Rainfall patterns
In a country as arid as Namibia, rainfall is the single most important factor in sustaining life and livelihoods. It varies dramatically seasonally, annually and geographically. Each year's falls are essential for replenishing Namibia's limited freshwater supplies, supporting natural vegetation, and determining the yields of crops and the success of domestic and wild animals in breeding and rearing their young.
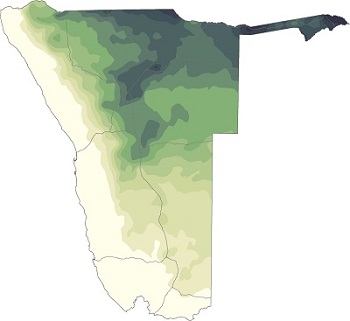
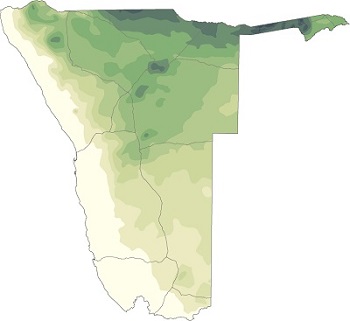
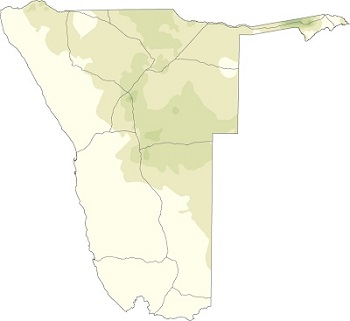
3.07 Annual rainfall and monthly rainfall16
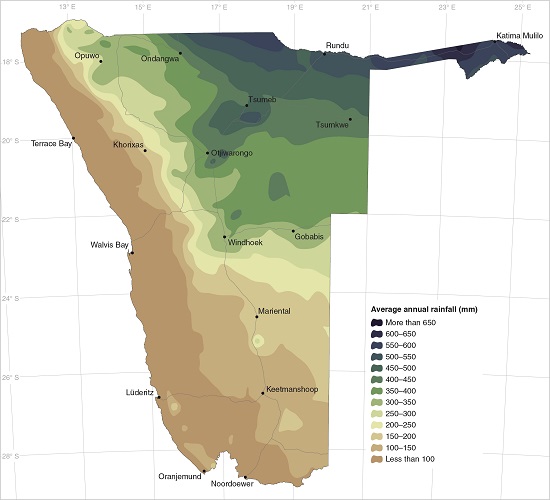
Average annual rainfall is calculated for the rainfall season, from the beginning of July of one year to the end of June in the following year. Along the coast and for some way inland rainfall is extremely low and highly variable (figure 3.10). Average rainfall within 40 kilometres of the coast is less than 20 millimetres per year, and most of this typically falls for short periods on only a few rainy days. By contrast, the northeastern areas of Namibia receive on average falls of more than 650 millimetres a year.
The great majority of rain in Namibia results from convective processes whereby heat causes moist air to rise, cool, condense and form dense cumulus clouds. Some inland areas, such as those around Otavi, Tsumeb and Grootfontein, have slightly higher rainfall than their surrounding areas due to orographic rainfall, which results from moist air being forced up over hills or mountains and cooled. Slightly higher patches of rainfall in the far southwest are the result of frontal rain received during the winter months when substantial cold fronts farther south reach into Namibia (figure 3.01).
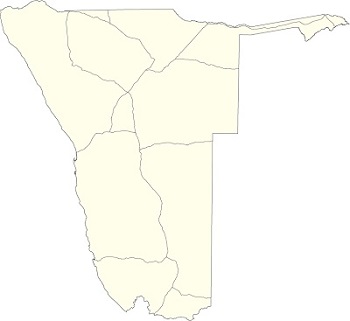
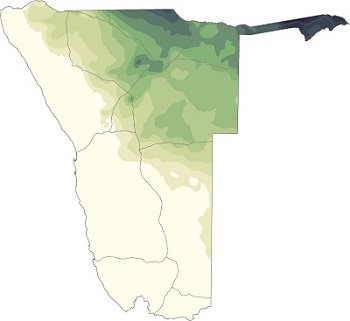
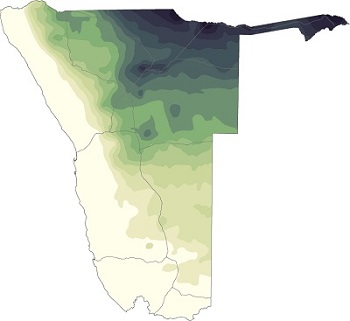
With the exception of the southwest, rainfall in Namibia is strongly seasonal. As the maps of average monthly rainfall show, from October to February rainfall gradually increases across the country from the east and north, retreating again during March and April.
But what makes Namibia so dry in-between times? As the Intertropical Convergence Zone shifts south in summer, the South Atlantic Anticyclone and Botswana Anticyclone push south, where their impact on Namibia's weather is limited (figure 3.01). However, they dominate weather in winter when they resume their northerly positions west and east of the country. Air descends in the anticyclones, drying as it subsides and spreads across Namibia and the rest of southern Africa. With the warm tropical air effectively blocked, the prevailing anticyclonic conditions produce clear, cloudless skies day after day between May and September.
May–September
October

November

December
January
February
March
April

3.08 Monthly rainfall in detail17
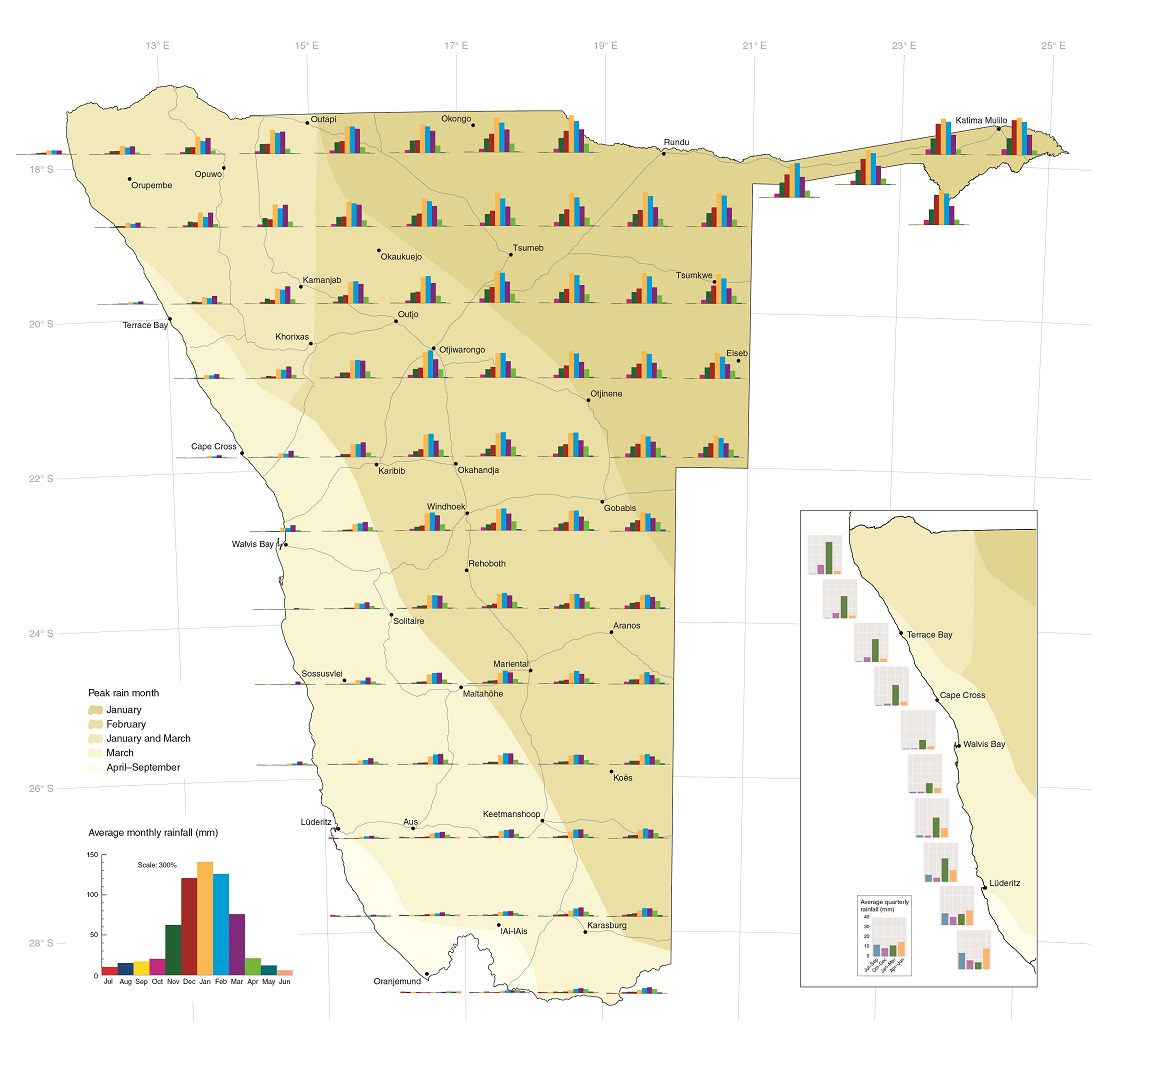
The maps in figure 3.07 provide an overview of rainfall patterns throughout the summer rainy season. This more detailed breakdown highlights east–west and north–south differences in the distribution of rain. Each graph shows the average rainfall per month in each degree square of latitude and longitude.
For most areas in Namibia, almost all rain falls in spring and summer between September and April. The only exception is in the southwest which lies in the winter temperate rainfall belt; here, monthly totals are similar throughout the year.
Within the summer rainfall area there is a clear trend linked to the movement of moist air. In the northeast rains start earlier, and peak months are December to February. Rain starts later in the south and west, with peak months from January onwards. On average, February and March are the months with the highest falls over the southern and western thirds of Namibia.
Along the entire coast, rainfall is generally very low. However, there are significant differences in the seasonal spread of rainfall between the southern and northern coast, as shown in the inset map. In the extreme southern areas, precipitation in winter sustains the Succulent Karoo vegetation (figures 6.01–6.03), which results in amazing desert blooms in August or September. Moving northwards up the coast, the chance of winter rainfall decreases while that of summer rainfall increases with highest summer averages in the far north which receives incursions of moist tropical air from Angola.

Photo: J Mendelsohn

Photo: V Morgante
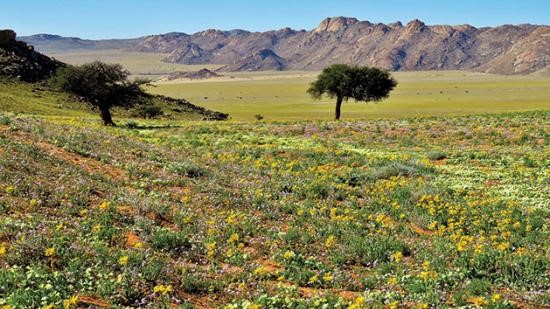
Photo: B Curtis
West of the escarpment, average rainfall figures are not terribly meaningful. Years may go by without a drop of rain. But, indigenous flora and fauna take advantage of a once-in-a-long-while good rainfall or a good season that transforms the landscape. Here and elsewhere, these first rains trigger the emergence and activity of invertebrates such as red velvet mites and dung beetles. The Succulent Karoo stretches from the Sperrgebiet in Namibia down the west coast of South Africa (figure 6.01). Although rainfall in this biome is very low, it can receive moisture all year round (figure 3.08). In spring, blooming wild flowers dress the landscape in a sea of colour.
3.09 Number of days per year with 1 millimetre of rainfall or more18
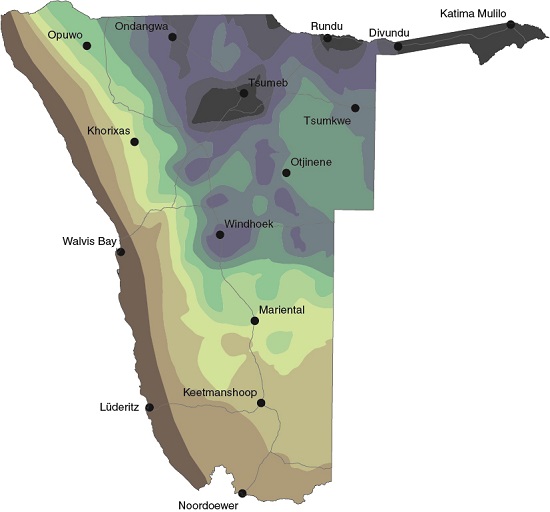

How does the limited rain in the western parts of Namibia fall – in light showers over many days or in heavier falls on just a few days? Taking a cut-off of 1 millimetre to exclude minor rainfall events, this map shows that the average frequency of rainy days rapidly increases eastwards of the coast. The coastal towns have significant rain on fewer than seven days per season on average while this increases to about 64 rain days at Katima Mulilo. Opuwo, on the escarpment, receives an average rainfall of 285 millimetres which falls over 33 rain days, on average.
Interestingly, Ondangwa in northern Oshana Region receives 175 millimetres less rain on average than Divundu in Kavango East, but its number of significant rain days is similar (50 and 55, respectively). This suggests that the intensity and/or duration of rainfall events increases eastwards in northern Namibia. In general, the pattern of this map mirrors that of annual rainfall (figure 3.07). The higher frequency of rain days in some areas reflects the increase in rainfall caused by local relief, such as around Otavi– Tsumeb–Grootfontein (Otavi Mountains), Windhoek (Auas Mountains) and west of Otjinene (Waterberg area).

Photo: T Robertson
A rainstorm gathers over the Fish River Canyon in December 2010. This part of the country receives rain on only a handful of days each year. Within hours after a downpour shoots of green growth appear in what was previously a barren landscape.
3.10 Variation in annual rainfall19
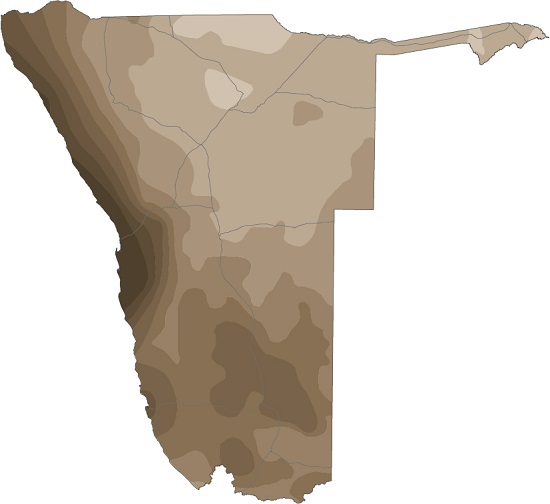
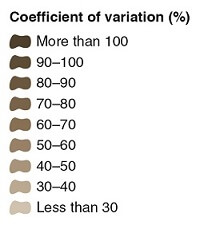
With the decline in rainfall from east to west, the frequency of rainfall events becomes more sporadic. This is reflected in the increasing degree of variability in annual rainfall compared to the longterm average, and is expressed as the coefficient of variation. As variability increases, rain-fed cultivation and other land-use practices become more marginal risk increases.
In Namibia's far western areas where variability is greatest, rainfalls may be brief but intense and cause disruption to coastal towns. For example, the longterm average annual rainfall at Lüderitz is just 16 millimetres but, in April 2006, 102 millimetres fell on the town over a three-day period. Such events are rare, irregular and are not expected to occur more than once in a century.20


Photos: T Robertson
The NamibRand Nature Reserve south of the Naukluft Mountains most commonly looks like the image taken in December 2000. The eastern margin of the reserve normally receives around 100 millimetres of rainfall; about twice as much fell in the 2010/11 rain season, transforming the landscape.
3.11 Windhoek's annual rainfall, 1901/02–2019/202121

The amount of rain that falls in one place in Namibia differs each and every year; in the best seasons it can be several times higher than rainfall in the worst seasons. In this series of total annual rainfall for 120 years, the five-year running average highlights the cyclical nature of longer-term changes. Troughs of low rainfall occur roughly every 14–15 years. While each cycle has had its highs and lows, it is the most recent cycle that has been the most variable, and is perhaps linked to the rapid change in climate over recent years (figure 3.23).
Global weather patterns influence rainfall variability between seasons, and extended dry periods are associated with well-known El Niño phases. These have their origins in the Pacific Ocean and are related to changes in sea surface temperature and atmospheric pressure. In general, lower falls are received in Namibia during El Niño years and higher falls during La Niña years.
3.12 Monthly rainfall totals at three locations, 2015/16–2019/202222

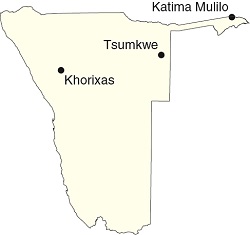
Rainfall from one season to the next is erratic. This holds true for most places in Namibia and is illustrated in these graphs of monthly rainfall over five consecutive seasons from 2015/16–2019/20 at Khorixas, Tsumkwe and Katima Mulilo. They show a high degree of variation in the amounts of rainfall received each month, in the spread of rainfall over the seasons and in the peak rain months each season. Successful crop farming requires some stability in the timing and consistency of rainfall events, and the inherent variability of rainfall in Namibia often leads to crop failures, or makes dryland cropping impractical.

