Sunshine hours and radiation
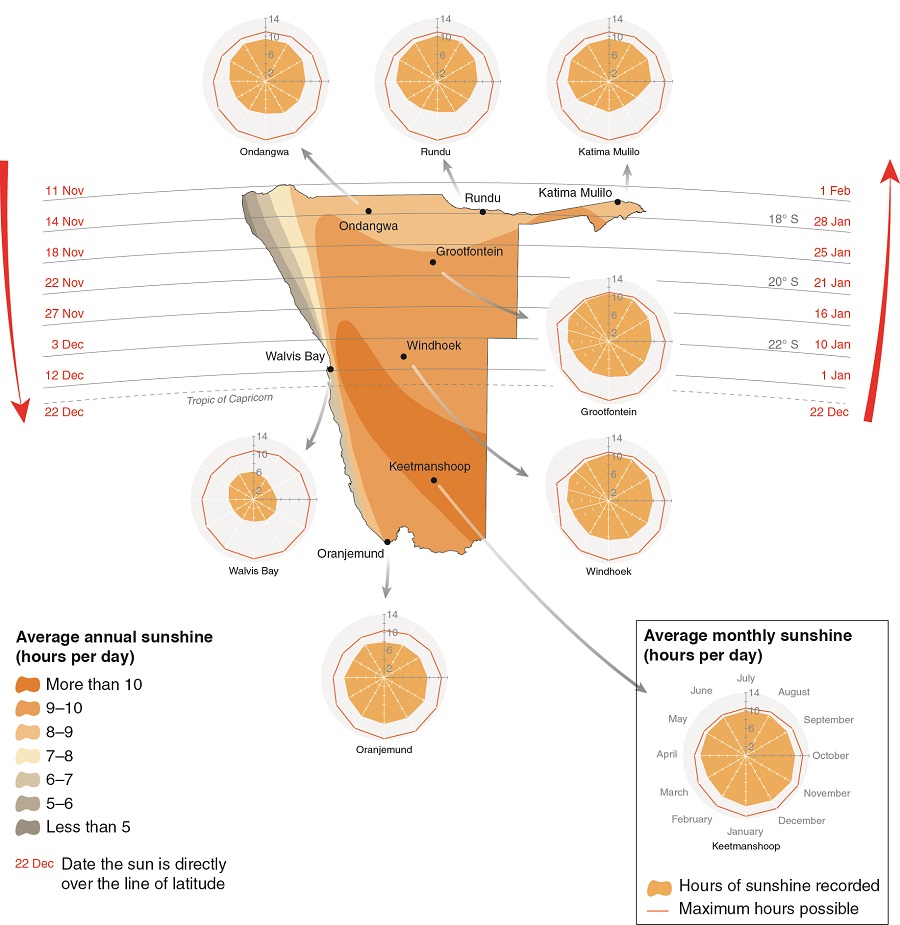
3.13 Number of sunshine hours per day23

The radial charts show the average number of sunshine hours each month at various locations as well as the maximum amount of sunshine possible. The predominance of fog and low cloud along the coastal belt limits sunshine along the coast. Averages of only 5–7 hours of sun are seen per day in the central coastal areas around Walvis Bay compared to 8–10 at Windhoek. During the rainy season, cloud cover limits the amount of sunshine received and this is evident by the decrease in sunshine hours during the rainfall months (October–April) in the northern and northeastern parts of the country. The southern central areas of Namibia see the most sunshine. Here, the days are the longest (in summer), cloud cover is rare and there is no fog. Along the central coast the amount of sunshine received increases slightly during the winter months when East Winds help clear away cloud and fog, but for the rest of the year the average daily duration of sunshine varies little.
The map shows the average number of sunshine hours over all months of the year. It also shows how the position of the sun shifts during the year by indicating the latitude at which the sun is positioned directly overhead at midday. This point gradually moves south in summer until Midsummer's Day on 22 December – the longest day of the year – when it is positioned directly over the Tropic of Capricorn, just south of Rehoboth. This point then retreats northwards again with the seasonal progression into the longer nights of autumn and winter. These seasonal changes are due to the orbiting of the tilted earth around the sun because in summer more of the southern hemisphere faces the sun, while in winter more of the northern hemisphere faces it. This causes day length to vary by several hours between the shortest and longest days. For instance, there is a difference of approximately two hours in day length between June and December at Ondangwa, while at Keetmanshoop the difference in day length is about 3.5 hours.
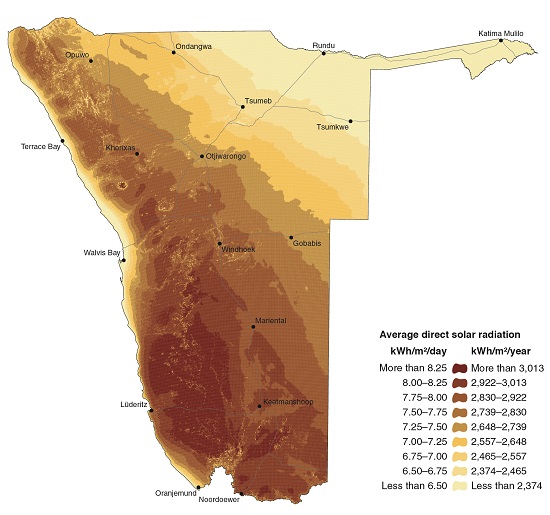
3.14 Average solar irradiance, 2005–201524


Photo: P van Schalkwyk
Solar power – or solar irradiance – is the amount of the sun's electromagnetic energy falling onto the surface of the earth. This is usually measured in the number of kilowatt-hours per square metre per day, or per year.
Several factors influence how much energy from the sun reaches the surface. First, atmospheric conditions such as cloud cover, dust and pollutants obscure the sun's direct rays. Second, is the effect of latitude. At places farther north or south of the equator the sunlight is angled increasingly more obliquely relative to the earth, so that solar radiation reaching its surface is spread diffusely across a greater area, and it has to pass through thicker layers of the atmosphere. Third, the seasons affect day length, which determines the number of hours the sun's rays hit the earth (see 3.13). Fourth, topography influences how shaded or exposed an area is to the sun.
This map shows the average amount of solar radiation received both directly and diffusely from the sun – known as global horizontal irradiance – across Namibia. This measure is important in the assessment of solar power potential for electricity generation. What is most noticeable in this map is the general inverse relationship between irradiance and rainfall (figure 3.07). The arid southern and western parts of the country, which have little cloud cover for much of the year, receive more solar radiation. Close to the coast, however, irradiance decreases sharply as the land surface is often shielded by fog and low cloud.

