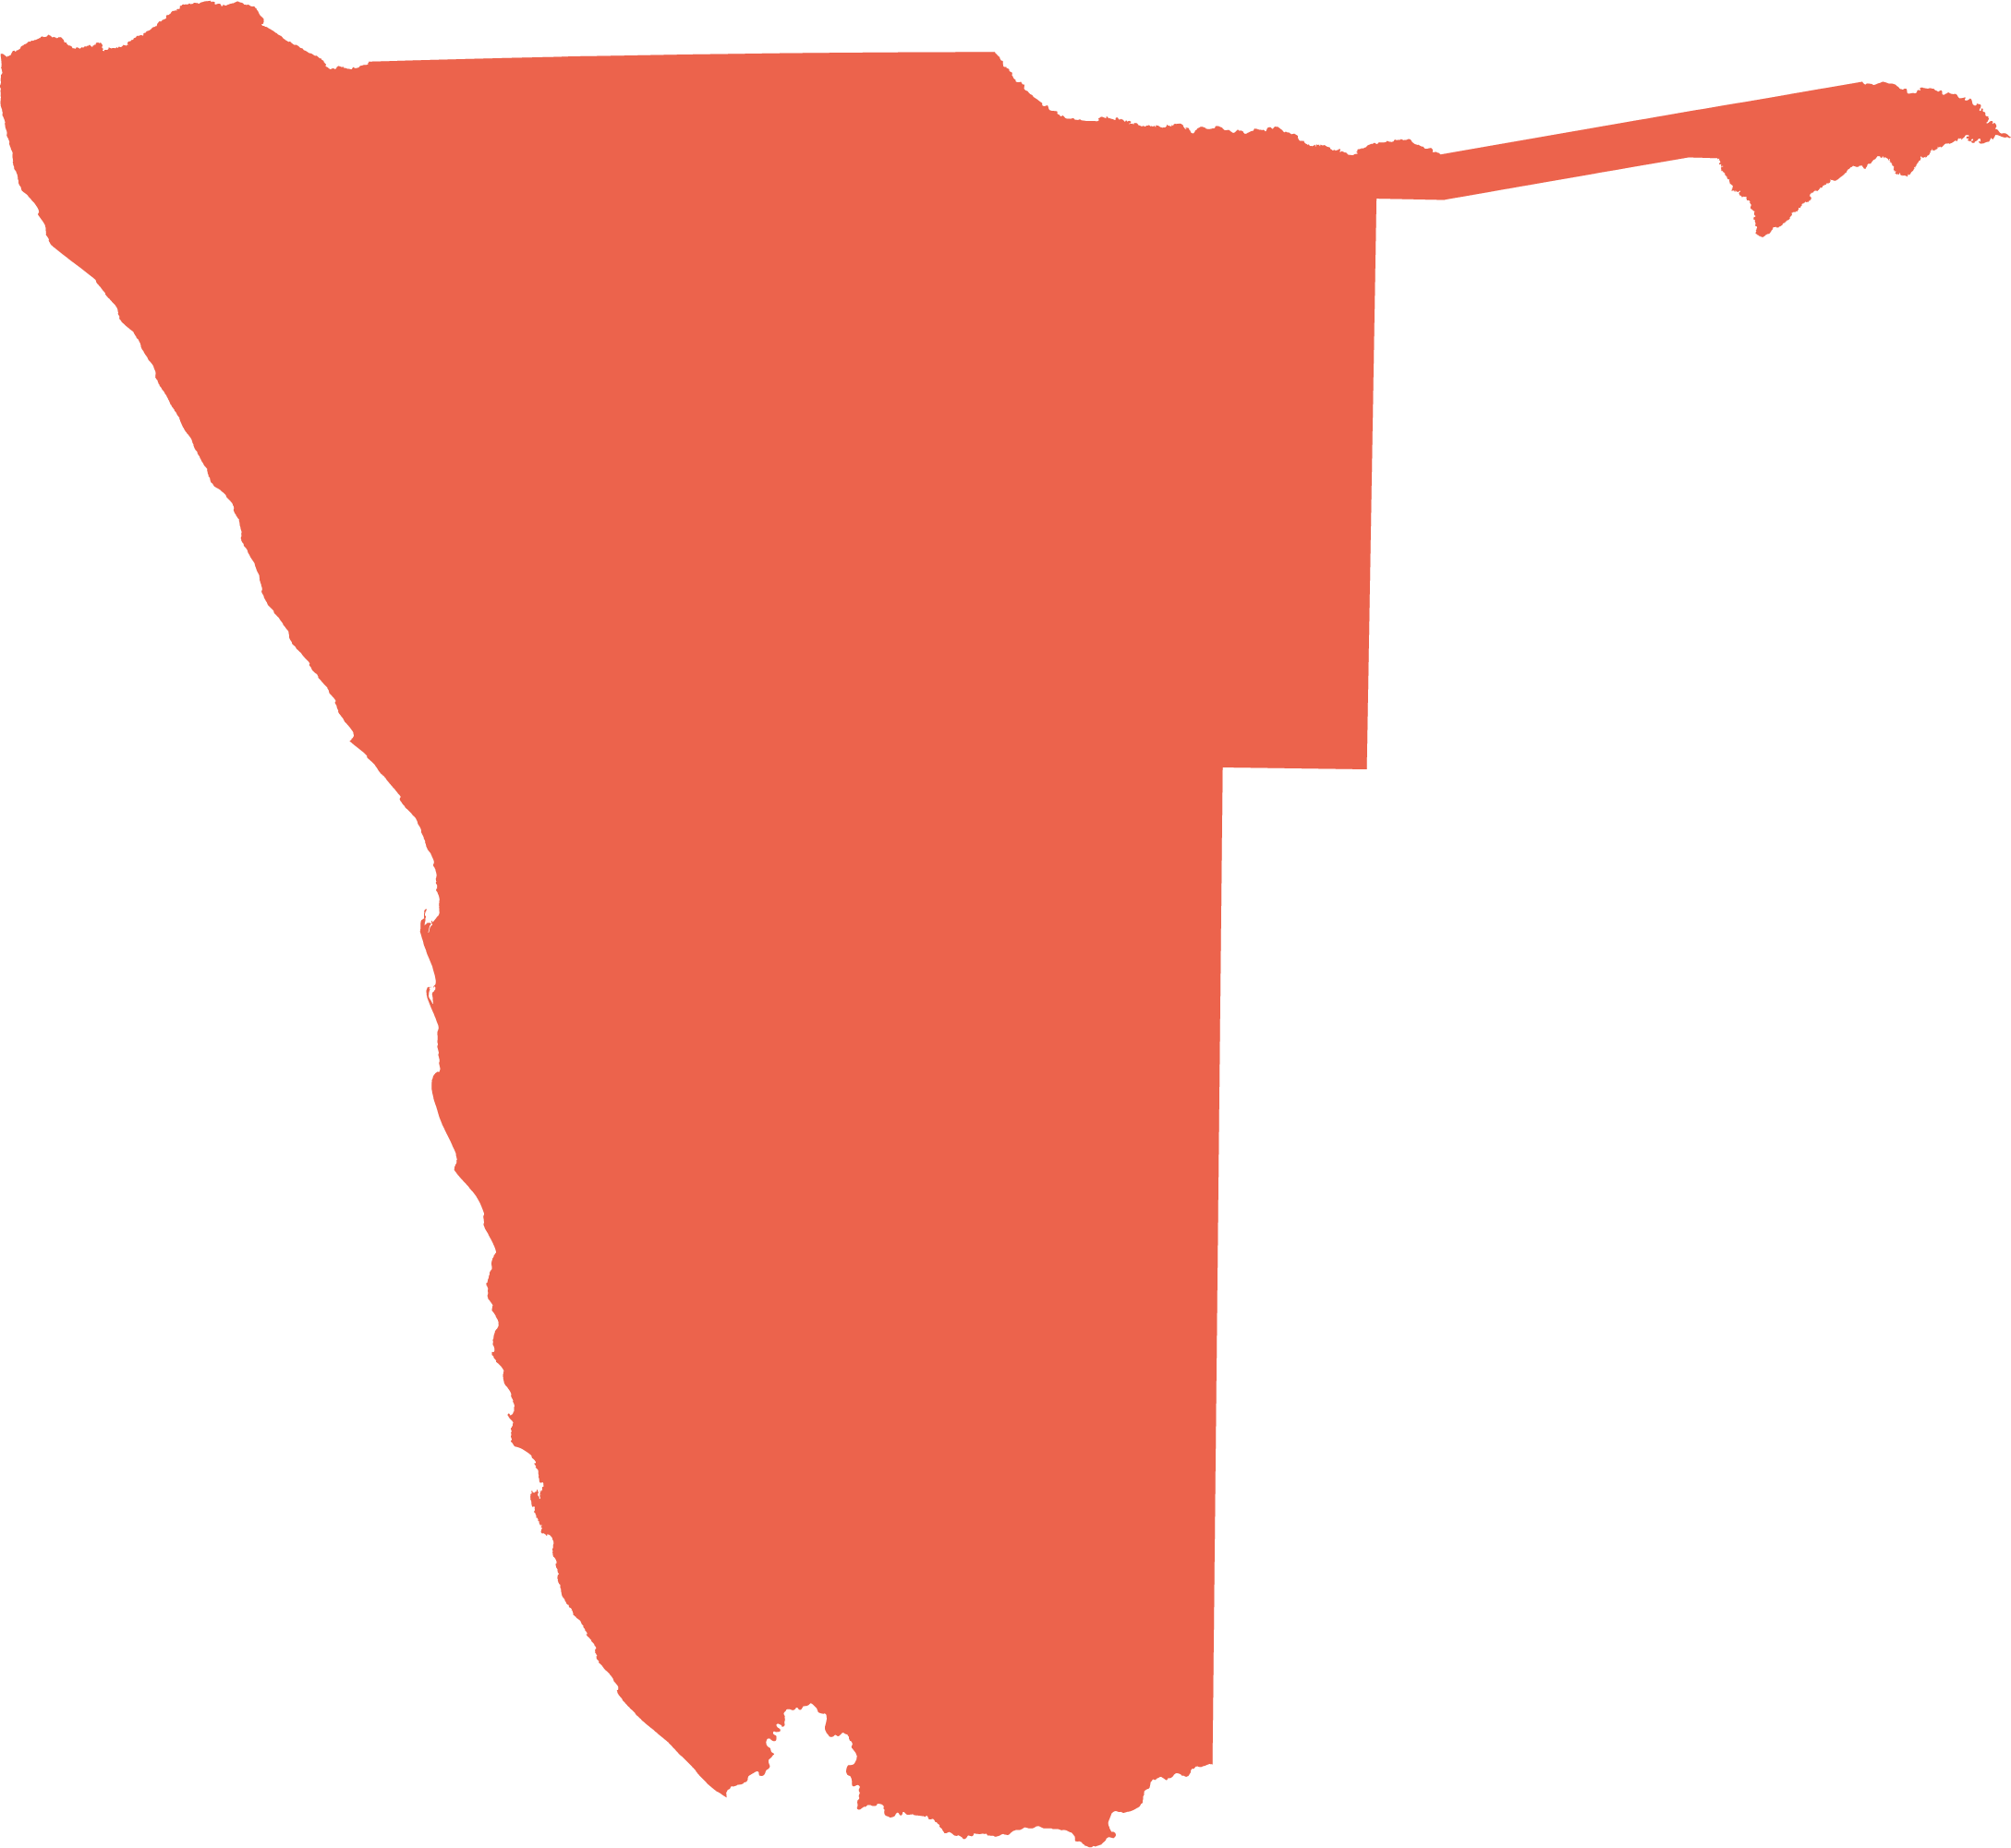

Dams
Namibia has thousands of dams, indeed almost 7,900 of them. All of them are on ephemeral watercourses. Most are small earth dams that store surface water for livestock and game on farms in a northwest–southeast swathe across the country. The deep sands in the Kalahari basin to the east and northeast are too flat and porous to collect and store much water, while low rainfall along the coast also makes building dams anywhere but along major rivers impractical. As a result, most of the dams are found in areas that have sufficient runoff and appropriate topography to store water in dammed impoundments.
4.22 Distribution of dams across Namibia25


Only a handful of dams are used to provide the public with potable water and water for industry and agriculture. Most other dams, especially the small ones, supply water for livestock and for some irrigation on private farms and in communal areas in the Cuvelai drainage system.
Water from the Omatako, Swakoppoort and Von Bach dams forms a vital component of supply to the central area of Namibia, whilst the Hardap and Naute dams supply irrigation schemes adjacent to them and the towns of Mariental and Keetmanshoop, respectively. The Otjivero silt and main dams, and the Tilda Viljoen and Daan Viljoen dams form part of the supply to Gobabis. The use of Neckartal, Namibia's largest and newest dam, is not yet clear.
4.23 Farm dams around Windhoek26

Image: Google Earth image via Terraincognita
The greatest density of dams is around Windhoek, where 1,046 dams are within a 50-kilometre radius of the city, equivalent to an average density of one dam every 750 hectares. Most of these are used to provide water for livestock. Some are used to help recharge groundwater. The dams vary in surface area, and silting has reduced the storage capacity of many. The shallowest dams lose water most rapidly to evaporation.
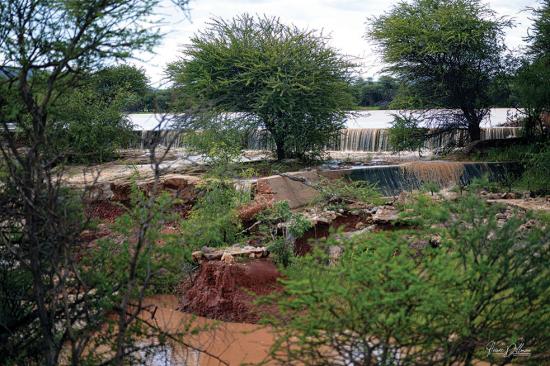
Photo: H Dillmann
Small farm dams may overflow after good rains allowing other dams downstream to fill.
4.24 Key statistics of bulk water dams, 2003–202027

Namibia's major dams differ significantly in terms of their size, how often they fill, and how long they hold water. The mode is the volume of water held and recorded most frequently, which may be zero in the case of dams that are empty much of the time, such as Omatako. Most of the dams have at some point or another exceeded their maximum capacity during recent years, and Mariental has been flooded in 1972, 1989, 2000 and 2006. However, Hardap is now managed so that it is never fuller than 70 per cent of its capacity to ensure dam safety and avert flooding of Mariental should there be a sudden inflow of water. Neckartal Dam was designed to provide water for 5,000 hectares of irrigation farming.
| Dam | Year completed | Purpose | River | Catchment size (km2) | Surface area (km2) | Capacity | Maximum | Mode | Minimum |
| Neckartal | 2019 | Not yet in use; designed to supply an irrigation scheme | Fish | 43,270 | 39.8 | 857.0 | 860.0 | – | 0.0 |
| Hardap | 1962 | Water supply: Mariental and Hardap Irrigation Scheme | Fish | 17,763 | 28.7 | 294.6 | 249.0 | 207 | 17.5 |
| Naute | 1972 | Water supply: Keetmanshoop and Naute Irrigation Scheme | Löwen | 8,675 | 1.5 | 83.6 | 92.7 | 72 | 41.9 |
| Swakoppoort | 1978 | Water supply: Central area | Swakop | 7,804 | 7.8 | 63.5 | 66.0 | 24 | 3.0 |
| Von Bach | 1970 | Water supply: Central area | Swakop | 2,958 | 4.9 | 47.5 | 49.1 | 25 | 4.7 |
| Olushandja | 1990 | Storage of reserve water from Calueque in Angola | Kunene transfers from Calueque | – | 29.0 | 45.6 | 36.7 | 11 | 1.8 |
| Omatako | 1981 | Water supply: Central area | Omatako | 6,845 | 12.5 | 43.5 | 46.9 | 0 | 0.0 |
| Omaruru Delta (Omdel) | 1984 | Aquifer recharge: Coastal area | Omaruru | 11,313 | 4.4 | 35.2 | 9.6 | 0 | 0.0 |
| Oanob | 1990 | Water supply: Rehoboth and irrigation | Oanob | 2,631 | 3.6 | 34.5 | 35.4 | 25 | 8.6 |
| Dreihuk | 1978 | Water supply: Karasburg | Hom | 1,594 | 3.5 | 15.5 | 8.8 | 0 | 0.0 |
| Otjivero Main | 1984 | Water supply: Gobabis | White Nossob | 2,023 | 1.5 | 9.8 | 10.4 | 6.00 | 0.2 |
| Otjivero Silt | 1984 | Silt trap for Otjivero Main | White Nossob | 2,023 | 3.6 | 7.8 | 10.8 | 0 | 0.0 |
| Friedenau | 1972 | Water supply: Matchless Mine | Kuiseb | 215 | 8.3 | 6.7 | 6.8 | 5 | 1.4 |
| Omatjenne | 1933 | Aquifer recharge | Omatjenne | 213 | 1.3 | 5.1 | 0.8 | 0 | 0.0 |
| Goreangab | 1958 | Water supply for Windhoek when built; currently stores surplus from Gammams Wastewater Treatment Plant | Gammams | 148 | 0.8 | 3.6 | 4.1 | 4 | 1.2 |
| Tilda Viljoen | 1958 | Water supply: Gobabis | Black Nossob | 5,391 | 0.2 | 1.2 | 1.23 | 1 | 0.0 |
| Bondels | 1959 | Aquifer recharge: Karasburg | Satco | 278 | 0.8 | 1.1 | 1.13 | 0 | 0.0 |
| Daan Viljoen | 1958 | Augmentation for Tilda Viljoen | Black Nossob | 5,390 | 0.2 | 0.4 | 0.45 | 0 | 0.0 |
| Dam | Neckartal |
| Year completed | 2019 |
| Purpose | Not yet in use; designed to supply an irrigation scheme |
| River | Fish |
| Catchment size (km2) | 43,270 |
| Surface area (km2) | 39.8 |
| Capacity | 857.0 |
| Maximum | 860.0 |
| Mode | – |
| Minimum | 0.0 |
| Dam | Hardap |
| Year completed | 1962 |
| Purpose | Water supply: Mariental and Hardap Irrigation Scheme |
| River | Fish |
| Catchment size (km2) | 17,763 |
| Surface area (km2) | 28.7 |
| Capacity | 294.6 |
| Maximum | 249.0 |
| Mode | 207 |
| Minimum | 17.5 |
| Dam | Naute |
| Year completed | 1972 |
| Purpose | Water supply: Keetmanshoop and Naute Irrigation Scheme |
| River | Löwen |
| Catchment size (km2) | 8,675 |
| Surface area (km2) | 1.5 |
| Capacity | 83.6 |
| Maximum | 92.7 |
| Mode | 72 |
| Minimum | 41.9 |
| Dam | Swakoppoort |
| Year completed | 1978 |
| Purpose | Water supply: Central area |
| River | Swakop |
| Catchment size (km2) | 7,804 |
| Surface area (km2) | 7.8 |
| Capacity | 63.5 |
| Maximum | 66.0 |
| Mode | 24 |
| Minimum | 3.0 |
| Dam | Von Bach |
| Year completed | 1970 |
| Purpose | Water supply: Central area |
| River | Swakop |
| Catchment size (km2) | 2,958 |
| Surface area (km2) | 4.9 |
| Capacity | 47.5 |
| Maximum | 49.1 |
| Mode | 25 |
| Minimum | 4.7 |
| Dam | Olushandja |
| Year completed | 1990 |
| Purpose | Storage of reserve water from Calueque in Angola |
| River | Kunene transfers from Calueque |
| Catchment size (km2) | – |
| Surface area (km2) | 29.0 |
| Capacity | 45.6 |
| Maximum | 36.7 |
| Mode | 11 |
| Minimum | 1.8 |
| Dam | Omatako |
| Year completed | 1981 |
| Purpose | Water supply: Central area |
| River | Omatako |
| Catchment size (km2) | 6,845 |
| Surface area (km2) | 12.5 |
| Capacity | 43.5 |
| Maximum | 46.9 |
| Mode | 0 |
| Minimum | 0.0 |
| Dam | Omaruru Delta (Omdel) |
| Year completed | 1984 |
| Purpose | Aquifer recharge: Coastal area |
| River | Omaruru |
| Catchment size (km2) | 11,313 |
| Surface area (km2) | 4.4 |
| Capacity | 35.2 |
| Maximum | 9.6 |
| Mode | 0 |
| Minimum | 0.0 |
| Dam | Oanob |
| Year completed | 1990 |
| Purpose | Water supply: Rehoboth and irrigation |
| River | Oanob |
| Catchment size (km2) | 2,631 |
| Surface area (km2) | 3.6 |
| Capacity | 34.5 |
| Maximum | 35.4 |
| Mode | 25 |
| Minimum | 8.6 |
| Dam | Dreihuk |
| Year completed | 1978 |
| Purpose | Water supply: Karasburg |
| River | Hom |
| Catchment size (km2) | 1,594 |
| Surface area (km2) | 3.5 |
| Capacity | 15.5 |
| Maximum | 8.8 |
| Mode | 0 |
| Minimum | 0.0 |
| Dam | Otjivero Main |
| Year completed | 1984 |
| Purpose | Water supply: Gobabis |
| River | White Nossob |
| Catchment size (km2) | 2,023 |
| Surface area (km2) | 1.5 |
| Capacity | 9.8 |
| Maximum | 10.4 |
| Mode | 6 |
| Minimum | 0.2 |
| Dam | Otjivero Silt |
| Year completed | 1984 |
| Purpose | Silt trap for Otjivero Main |
| River | White Nossob |
| Catchment size (km2) | 2,023 |
| Surface area (km2) | 3.6 |
| Capacity | 7.8 |
| Maximum | 10.8 |
| Mode | 0 |
| Minimum | 0.0 |
| Dam | Friedenau |
| Year completed | 1972 |
| Purpose | Water supply: Matchless Mine |
| River | Kuiseb |
| Catchment size (km2) | 215 |
| Surface area (km2) | 8.3 |
| Capacity | 6.7 |
| Maximum | 6.8 |
| Mode | 5 |
| Minimum | 1.4 |
| Dam | Omatjenne |
| Year completed | 1933 |
| Purpose | Aquifer recharge |
| River | Omatjenne |
| Catchment size (km2) | 213 |
| Surface area (km2) | 1.3 |
| Capacity | 5.1 |
| Maximum | 0.8 |
| Mode | 0 |
| Minimum | 0.0 |
| Dam | Goreangab |
| Year completed | 1958 |
| Purpose | Water supply for Windhoek when built; currently stores surplus from Gammams Wastewater Treatment Plant |
| River | Gammams |
| Catchment size (km2) | 148 |
| Surface area (km2) | 0.8 |
| Capacity | 3.6 |
| Maximum | 4.1 |
| Mode | 4 |
| Minimum | 1.2 |
| Dam | Tilda Viljoen |
| Year completed | 1958 |
| Purpose | Water supply: Gobabis |
| River | Black Nossob |
| Catchment size (km2) | 5,391 |
| Surface area (km2) | 0.2 |
| Capacity | 1.2 |
| Maximum | 1.23 |
| Mode | 1 |
| Minimum | 0.0 |
| Dam | Bondels |
| Year completed | 1959 |
| Purpose | Aquifer recharge: Karasburg |
| River | Satco |
| Catchment size (km2) | 278 |
| Surface area (km2) | 0.8 |
| Capacity | 1.1 |
| Maximum | 1.13 |
| Mode | 0 |
| Minimum | 0.0 |
| Dam | Daan Viljoen |
| Year completed | 1958 |
| Purpose | Augmentation for Tilda Viljoen |
| River | Black Nossob |
| Catchment size (km2) | 5,390.2 |
| Surface area (km2) | 0.2 |
| Capacity | 0.4 |
| Maximum | 0.45 |
| Mode | 0 |
| Minimum | 0.0 |
4.25 Water volumes in four supply dams, 2003–202028

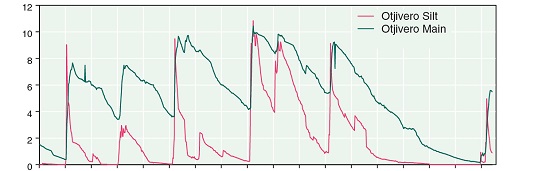
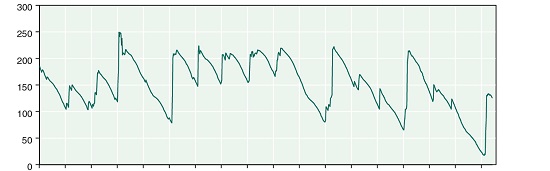
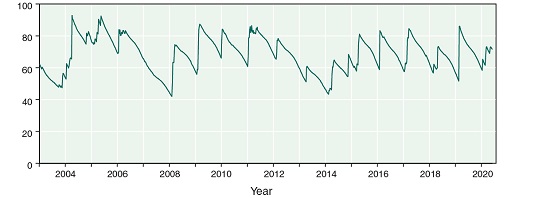
These graphs illustrate how the levels of some major supply dams have changed and varied from one dam to another. Whilst those with large catchments in areas of higher rainfall have filled quite regularly, others have only filled sporadically. Decreases in volume between years have depended on how much of the water was used, and on how much was lost to evaporation or underground seepage into aquifers.
Photo: H Denker
While most dams function to store water for regular supply to consumers, others have been built for somewhat different purposes. Olushandja is used as a long-term reserve supply of water for central-northern Namibia; it receives its water from the Calueque Dam on the Kunene River in Angola. The Omaruru Delta (Omdel) and Bondels dams are used to enhance aquifer recharge by trapping water over an area that allows water to percolate underground into aquifers where it cannot be lost to evaporation. Similarly, in good rain years, some water from Von Bach Dam is used to recharge the Windhoek aquifer. Many farmers have built smaller dams and berms to encourage local aquifer recharge on their farms too.

Photo: H Denker
Most water from dams, if it is not pumped for use elsewhere, is lost to evaporation. For example, once the shallow Omatako Dam is full, up to 80 per cent of its total capacity can be lost in a year to evaporation from its large surface, while the deeper Von Bach Dam would only lose around 24 per cent of its water. For this reason, much of the water from the Omatako Dam is pumped to Von Bach for longerterm storage. Transfers also occur from the Swakoppoort Dam to Von Bach, but for a different reason. Concentrations of sodium, chloride, magnesium and sulphide salts in Swakoppoort Dam increased between 2011 and 2017, making its water unsuited to drinking. It is not clear why these high concentrations developed, but one possibility is that the minerals were introduced through polluted water from Windhoek. Another theory is that the minerals were leached out of rocks beneath the Windhoek area during the heavy rains in 2011. Whatever the reason, Swakoppoort water transferred to Von Bach can then be mixed and diluted to an extent so that it can be added to supplies of water for Windhoek and Okahandja.