Plant productivity5
Plants use minerals, water and solar energy to grow and produce leaves, roots, wood, fruit and seeds, and in so doing provide various resources and services for people, animals and the environment. Plant productivity is thus vital. It is measured to assess and understand how it varies across Namibia, as well as from month to month and from one growing season to the next. The maps presented here illustrate these kinds of variation.
Factors that influence plant productivity include soil, climate, herbivory, disease, fire and even the concentration of atmospheric carbon dioxide. Some of these factors, such as rainfall and fire, vary from one season to the next, and are being altered by human activity through new land uses and global atmospheric changes.
6.09 Plant productivity in five seasons
2002/03

2005/06

2010/11
2015/16

2018/19


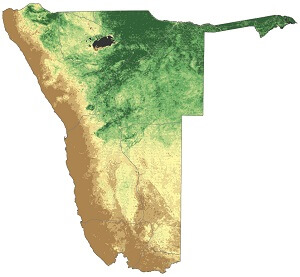
Each map shows the cumulative plant growth in a season that extends from July in one year to June in the following year, thus encompassing Namibia's seasonal summer rains. Together, these five maps illustrate how productivity varies between particularly dry (bad) seasons (2002/03, 2015/16 and 2018/19), an average season (2005/06) and a bumper wet season (2010/11).
Even in bumper seasons, plant production in Namibia, especially in the most arid western, central and southern areas, is much lower than in most parts of Africa south of the Sahara. This is a direct consequence of limited rainfall, high evaporation and low soil fertility in much of Namibia.
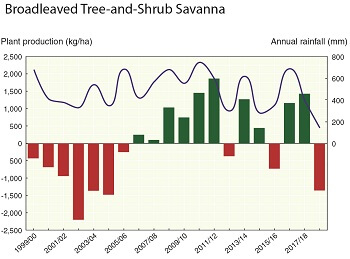
6.10 Relationship between plant productivity and seasonal rainfall in Namibia's five major biomes6




Namib Desert

Succulent Karoo

Nama Karoo

Acacia Tree-and-Shrub Savanna

Broadleaved Tree-and-Shrub Savanna
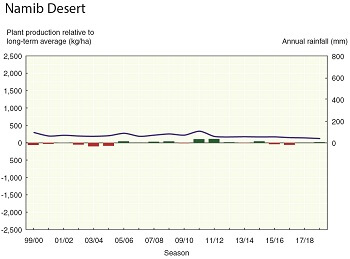
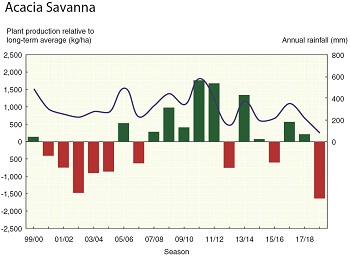
Direct links between rainfall and plant production are normally obvious to everyone in Namibia. Seasonal measures of rainfall and plant production often confirm the relationship when the two measures are correlated, as shown in these graphs. Sometimes the relationship is weak or not clear, however. This may happen when substantial falls of rain occur at widely spaced intervals or are concentrated into short periods. Plants then benefit little from the rain, either dying off between spells of rain or withering away when good rains are not followed by further falls. Or good rain may fall late in the season when cold conditions inhibit plant growth.
These graphs do, however, highlight seasons and periods when vegetation production was either higher or lower than normal. During the 20 years between 1999/00 and 2018/19, production was low up to 2004/05, and then again between 2015/16 and 2018/19. Much greater plant production was measured between 2005/06 and 2011/12. The graphs also show how both plant production varies little in the driest areas of Namibia, in particular in the Nama Karoo and Succulent Karoo biomes.
» View/download chart - Namib (jpg)
» View/download chart - Succulent Karoo (jpg)
» View/download chart - Nama Karoo (jpg)
» View/download chart - Acacia Tree-and-Shrub Savanna (jpg)
» View/download chart - Broadleaved Tree-and-Shrub Savanna (jpg)
» View/download map - Namib (jpg)
» View/download map - Succulent Karoo (jpg)
» View/download map - Nama Karoo (jpg)
» View/download map - Acacia Tree-and-Shrub Savanna (jpg)
» View/download map - Broadleaved Tree-and-Shrub Savanna (jpg)
6.11 Average seasonal plant productivity, 2000/01–2018/19

The highest biomass production is in the northeast, especially in dense woodlands in Zambezi, Kavango West and Ohangwena. The savannas of the Karstveld on and around the hills in the Tsumeb–Grootfontein–Otavi area also produce substantial biomass. Plant productivity declines southwards and westwards as one might expect with decreasing average rainfall (figures 3.07 and 6.10).
Other characteristics of plant productivity are also evident. Very little grows in saline soils, such as those west of Etosha Pan. Plant productivity is also low in the densely populated Cuvelai drainage basin north of Etosha Pan; here, woodlands have been mostly cleared and the area consists of saline grasslands, oshana watercourses and vegetation grazed short by the high density of livestock. Similar degradation and low plant productivity is apparent around the town of Rundu and along the Okavango River and the road southwest of Rundu.
There are also distinct differences in plant productivity between vegetation types. For example, biomass production changes abruptly between Northeastern Kalahari Woodland and the Cuvelai, and between the Southern Kalahari and Karas Dwarf Shrubland boundaries, mainly due to soil differences (compare figures 5.01 and 6.02). Black areas on the map show where terrestrial plant production is absent (large saltpans) or areas that remain flooded for extended periods, such as dams, perennial rivers or areas of the Zambezi floodplains.

Photo: H Baumeler
The map above is too small to show small patches of higher production, such as in the riparian woodlands of ephemeral rivers. The example shown here is the Auob River at Gochas. Likewise, low plant production in degraded areas around the country is often too small and inconspicuous to show on a map of that scale.
6.12 Variability in seasonal plant productivity, 2000/01–2018/19

Measured as the coefficient of variation, this map shows the degree (expressed as a percentage) to which plant productivity fluctuates from 'normal' or average. Variation is lowest at opposite extremes of productivity: in the northeastern woodlands where productivity is relatively high every year and in the Namib Desert where productivity is relatively low, even when there is rain. The greatest variation in plant productivity from season to season is along the western escarpment, the southern areas of Namibia and in the Central Kalahari and Southern Kalahari vegetation types in the southeast. Throughout Namibia, the production of grass cover is more variable than that of cover produced by trees and shrubs because the growth of grass is more dependent on recent rainfall than that of woody plants. For this reason, grassland areas show more variability than adjacent areas of woodland.
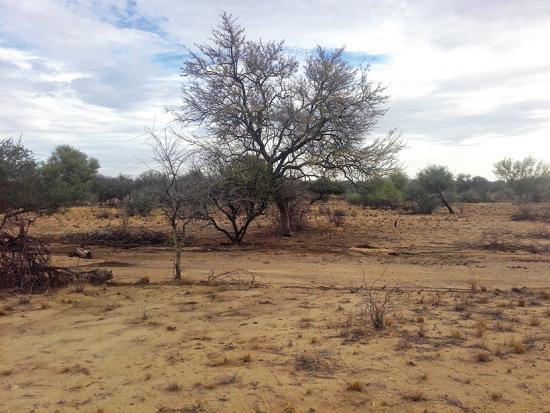
Photo: C van Der Waal

Photo: C van Der Waal
Too often and too long, desperately dry conditions persist, seemingly with no end or change in sight (first photo). But then the rains arrive, bringing about dramatic changes (second photo). The transformation seen here near Omaruru does not happen to this degree every year, nor everywhere. Much depends on rainfall to stimulate seeds to germinate, and to sustain the plants as they grow, flower and produce more seed. The most productive years are the consequence of frequent falls of rain spaced over two or three months, whereas falls of rain in the least productive years are too small or too infrequent, or come too late in the season.
6.13 Variation in seasonal grass growth over 17 years7

This graph provides an example of the variation in grass growth on a farm in Erongo Region where plant production is highly variable. The standing crop of grass measured at the end of each season varied 15 fold from less than 60 kilograms per hectare in the driest 2015/16 season to more than 900 kilograms per hectare in 2010/11 when rainfall was plentiful. This illustrates the tremendous variability that grazing animals and farmers must cope with from season to season. Browsers, which feed on shrubs and trees, are also challenged during poor rainfall seasons when deciduous trees and shrubs are leafless for a longer period during the dry season. Herbivore carrying capacity (i.e. the land's ability to support herbivores) is therefore not constant, but varies from year to year. Farmers thus need to be prepared to respond to low production seasons in a timely fashion by selling stock, moving animals to areas with better grazing or providing feed to animals.
6.14 Average monthly variability in plant production, 2000/01–2018/19
July

August
September
October
November

December
January
February
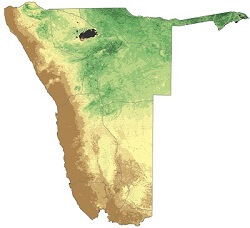
March

April

May

June

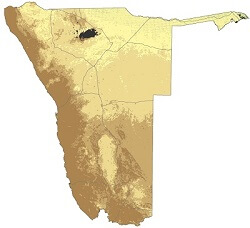
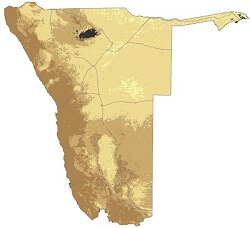
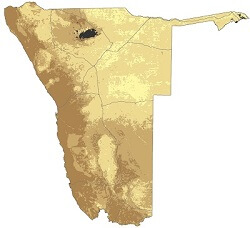
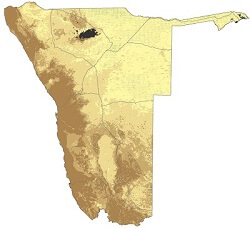
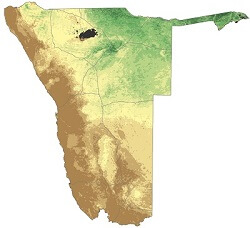
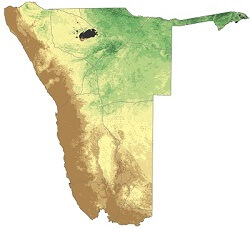
Plant productivity varies a great deal within a season. Most of Namibia gets its rainfall in the second half of the summer, and so January, February and March tend to be the most productive months, in stark contrast with July to October when little plant growth takes place. At the start of a new season, plant growth is first evident in the northeast in November, especially in areas dominated by trees and shrubs which produce leaves at this time. The northeast is also more likely to receive rain earlier (figure 3.09), which would stimulate the growth of annuals. The eastern parts of the Zambezi floodplains have new plant growth in June and July, when floods subside but the soils still hold water.
» View/download map - July (jpg)
» View/download map - August (jpg)
» View/download map - September (jpg)
» View/download map - October (jpg)
» View/download map - November (jpg)
» View/download map - December (jpg)
» View/download map - January (jpg)
» View/download map - February (jpg)
» View/download map - March (jpg)
» View/download map - April (jpg)
» View/download map - May (jpg)
