Mining
8.14 Active mines and mining claims19

While the area of land used for mining may not cover much of the country's surface, its contribution to Namibia's economy is significant. Indeed, mining contributes more to Namibia's GDP than any other sector, and diamonds provide the greatest part of that contribution. Large active mines are indicated by active mining areas here, while smaller mining claims which may be active or inactive are marked by points. In 2020 when this map was compiled, rare metals mined included zinc, tin, iron, tantalite, lead and copper; industrial minerals included limestone, gypsum, fluorspar, graphite and salt; precious metals were limited to gold and silver; dimension stone included granite, marble, dolerite, sodalite, sandstone and crushed stone; precious stones were limited to diamonds; semi-precious stones included tourmaline, rose quartz, aquamarine and garnet; and the nuclear fuel material mined was uranium.
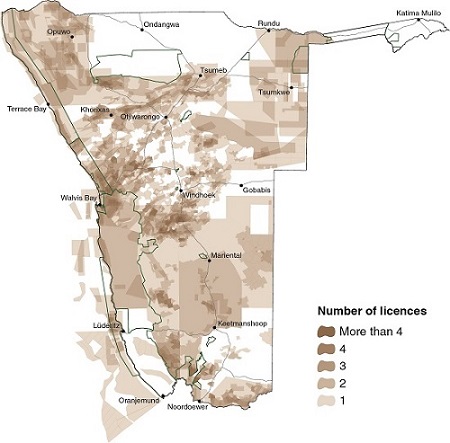
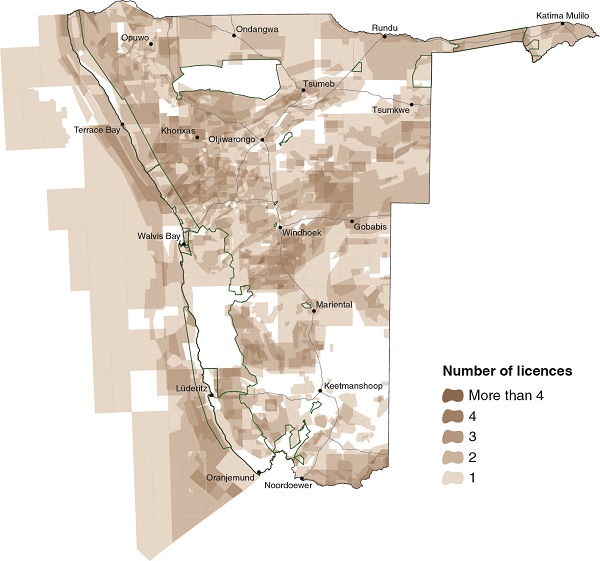
8.15 Mining and exploration licences, 1950–1999 and 2000–202020
1950-1999

2000-2020

The distribution of mining and exploration licences for minerals varies across the country. The greatest density of claims stretches between Walvis Bay, Windhoek, Khorixas and the Kunene River. There are comparatively few licences in areas where the underlying geology has been covered by Kalahari or Namib sands. Offshore licences are mainly for petroleum prospects.

Photo: H Baumeler
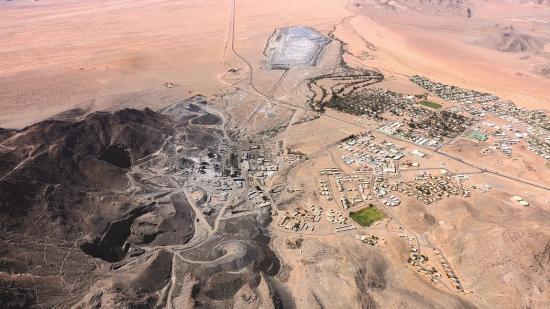
This aerial photo shows the town and mine at Rosh Pinah where lead and zinc are mined. The mine was established in 1969. Twenty kilometres northwest of it is Skorpion, which is one of the most productive zinc mines in the world.

Photo: O Ernst & H Baumeler
The tailings facility of the Swakop Uranium mine, known also as Husab, which began production in 2016. Ten per cent of the mining operation is owned by the Namibian state through the Epangelo Mining Company while the remaining 90 per cent belongs to Chinese enterprises.

