Housing types and materials
9.27 Housing types in regions and urban and rural areas, 1991–201643

Namibia

Urban and rural


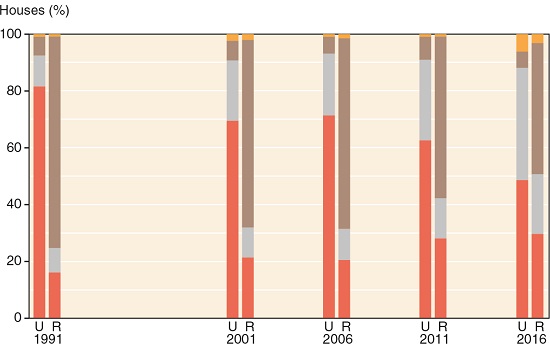
Countrywide, the proportion of formal brick-and-cement or prefabricated homes remained relatively constant at about 40 per cent between 1991 and 2016. The biggest changes were in the substantial decrease in the proportion of traditional homes of wood and thatch in rural areas and the increase in the proportion of corrugated-metal shacks in urban areas. These trends in housing reflect the large-scale migration of people from rural to urban areas. Also reflected here is the growing change from traditional to formal homes in communal rural areas during this period, most substantially in the northern regions of Ohangwena, Omusati, Oshana and Oshikoto, and to a lesser degree in Kavango West, Kavango East and Otjozondjupa.
The regional graphs summarise information on the three major types of housing recorded during the censuses held in 1991, 2001 and 2011. The graphs below include information from the intercensal surveys held in 2006 and 2016, and also show the proportions of 'other housing', such as tents or caravans.
9.28 Growth in housing, past (1991–2011) and projected (2011–2031)44

Urban migration and growth has been substantial in recent decades. Normally, housing areas would have been planned and set aside as towns expanded. Planned houses would then be built on formal plots of land in these areas. Whilst some formal growth and planning continued, it has been rapidly overtaken by informal growth. For example, the number of formal houses roughly doubled from 73,881 to 163,793 between 1991 and 2011, while the number of shack homes in urban areas increased more than seven-fold from 10,288 to 77,899 over the same period. In 1991, 81.5 per cent of all urban houses were made from bricks, blocks or were prefabricated and only 10.9 per cent were shacks, but by 2011 one third (32 per cent) of all urban homes were shacks.

Photo: B Weber
The average annual rate of growth in the number of urban shacks between 1991 and 2011 was 10.6 per cent – this also provides a measure of how demand for formal houses increases each year. Should this rate of increase continue, by 2025 shacks will be the predominant form of house in Namibia outnumbering formally built urban houses and all rural houses. In 2030 there are likely to be about 500,000 urban shacks housing approximately two million people; the number of urban homes will then be about 3.5 times greater than the number of all rural homes.45

Photo: H Denker

Photo: H Denker
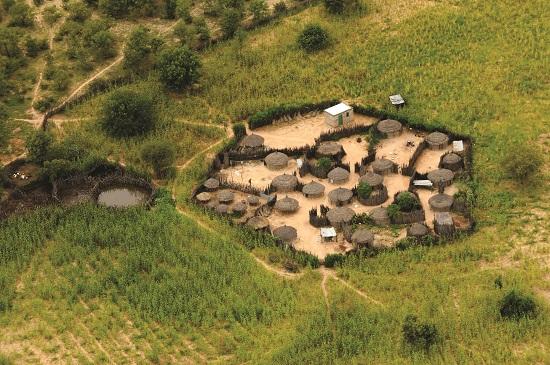
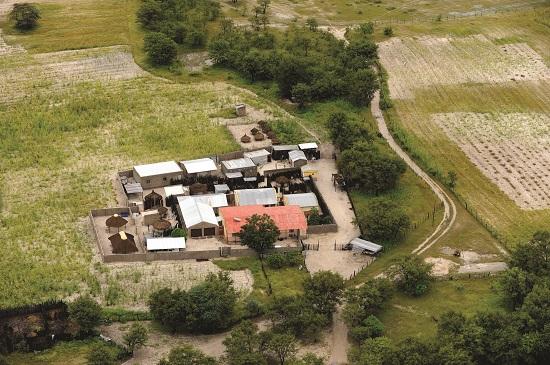
The types of houses found in communal rural areas provide a measure of how household economies there are changing rapidly from subsistence farming to income-based livelihoods. More and more modern brick-and-mortar homes are being built as the supply and availability of money increases, and urban wage-earners and businessmen build second homes as investments and for holidays and retirement in and around their home villages. Although the two households shown here differ in affluence – one built using family labour and local wood, the other with bought labour and fabricated materials – both have traditional granaries to store harvests of mahangu (pearl millet), emphasising the importance of food reserves in areas that have experienced devastating famines.46 The granary of these 'eeshisha' baskets of the brick home is at the back outside the homestead, while those of the more traditional home are within the homestead in the front left corner.
9.29 Proportion of households without access to toilet facilities, 201147

The great majority of households that lack improved sanitation – flush, dry, pit or bucket toilets – are in northern Namibia and other rural communal areas. Crowded, unsanitary conditions are most prevalent and concerning in low-income, informal urban settlements where the risk of disease transmission can be significant. In 2011 there were about 57,000 urban households with approximately 250,800 residents lacking access to any toilet facilities. Census results also showed that the percentage of urban residents without toilets almost doubled from 13 per cent in 1991 to 24 per cent in 2011.
9.30 Household sanitation facilities, 1992–201648


Over the years, about half of all Namibian homes had no formal toilet facilities, and thus had to use the bush for nature's calling. That proportion decreased from 57.9 per cent in 1992 to 45.7 per cent in 2016, although the total number of homes without toilets increased as the number of homes rapidly increased with population growth. For example, 187,778 homes in 2001 – or 54.2 per cent of homes at that time – did not have toilets, whereas 225,911 in 2011 (48.6 per cent of homes) did not have toilets. While the graphs show a marked decrease in the proportion of rural homes with bush toilets between 1992 and 2016, there was an equivalent marked increase in the proportion of urban homes with no toilets during the same period.

