The demography of Namibians
Population numbers and growth
9.16 Namibia's urban and rural population, 1921–202230
| Population numbers | ||||
|---|---|---|---|---|
| Census year | Urban | Rural | Total | % urban |
| 1921 | 228,916 | 228,916 | ||
| 1936 | 31,321 | 289,136 | 320,457 | 10 |
| 1946 | 52,258 | 310,206 | 362,464 | 14 |
| 1951 | 70,256 | 368,825 | 439,081 | 16 |
| 1970 | 189,094 | 571,916 | 761,010 | 25 |
| 1981 | 261,301 | 771,895 | 1,033,196 | 25 |
| 1991 | 455,840 | 954,075 | 1,409,915 | 32 |
| 2001 | 676,194 | 1,187,540 | 1,863,734 | 36 |
| 2011 | 903,434 | 1,209,643 | 2,113,077 | 43 |
| 2022* | 1,389,669 | 1,206,368 | 2,596,037 | 54 |

In the 101 years between 1921 and 2022, the number of people in Namibia is estimated to have grown 11-fold: from about 228,900 in 1921 to about 2,600,000 people in 2022.31 Roughly 10 per cent of Namibia's population lived in towns in 1936. That proportion has grown steadily and rapidly as more and more Namibians moved into towns, and rural settlements grew into large villages and then into towns. In 2011, urban residents made up 43 per cent of the population, and by 2022 the proportion of townsfolk was projected to be 54 per cent. Two thirds (67 per cent) of the population is expected to live in urban areas by 2041, leaving one third (33 per cent) in rural areas.32 The ratios of urban and rural residents will then be the opposite of those 50 years previously when only 32 per cent of people were in towns.
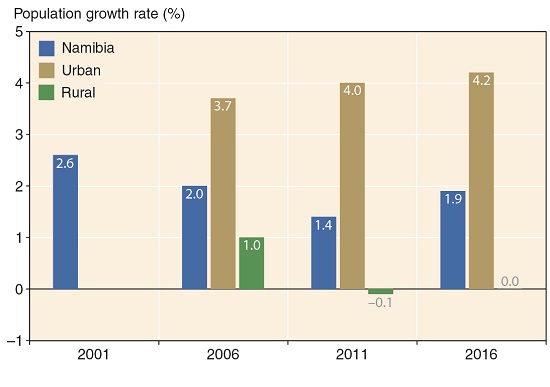
9.17 Population growth rates33

Until 1991, average annual population growth rates were 3.0–3.5 per cent. This rate decreased to 2.6 per cent in 2001 and subsequently lower, ranging between 1.4 and 2.0 per cent in the period 2006–2016. Urban populations have been growing at about 4 per cent per year in recent decades. Rural populations stopped growing by 2011, and are projected to decline steadily as Namibians continue to be attracted to urban areas.
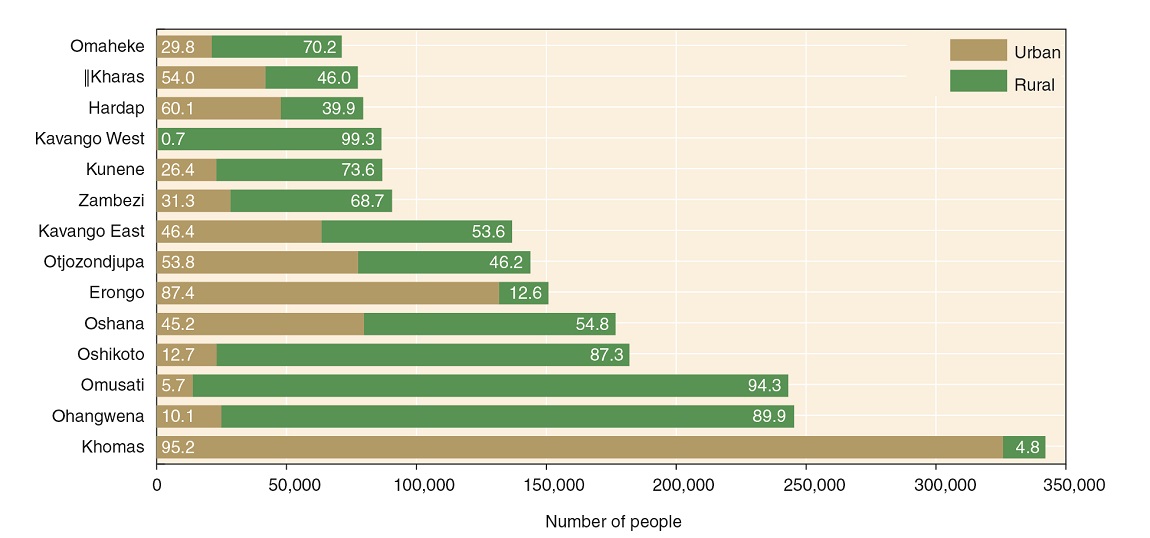
9.18 Proportions and numbers of urban and rural residents in each region, 201134

Namibia has been urbanising rapidly, but the places and rates at which this has happened differ across the country. In 2011, four regions – Kavango West, Omusati, Ohangwena and Oshikoto – had small proportions (less than 20 per cent) of urban residents; Kunene, Omaheke and Zambezi had between 20 and 40 per cent of their populations in towns; Oshana, Kavango East, Otjozondjupa, ǁKharas and Hardap had between 40 and 60 per cent of people in urban areas; while Erongo and Khomas stood out in having 87 and 95 per cent of their populations in towns, respectively. In 2011, Windhoek housed 15 per cent of the total population, and 36 per cent of the total urban population.
While the increasing number of people in urban areas is clear, some statistics are influenced by changes in the classification of enumeration areas. For example, an area regarded as rural in one census could be classified as urban in the next census. The major difference in the ratios of urban to rural residents in Kavango West in comparison to Kavango East is a consequence of the decision to include Rundu in Kavango East when it was separated from Kavango West. Even though new towns such as Katwitwi and Nkurenkuru in Kavango West, and Ndiyona and Divundu in Kavango East are growing rapidly, they are much smaller than Rundu.

Photo: B Weber
This housing development of Kanaan in Gobabis – new at the time of publication – has helped accommodate people who moved to town. The fastest growing urban areas between 2001 and 2011 were Oshakati and Rundu with annual growth rates of 6.9 and 6.1 per cent, respectively. If those rates continue, these towns will double in size every 11–12 years. Other rapidly growing towns were Eenhana, Helao Nafidi, Okahao, Omuthiya, Ondangwa, Outapi, Swakopmund and Walvis Bay. Windhoek is by far the largest urban area in Namibia; it was home to 323,500 people in 2011 after having grown at 3.5 per cent per year since 2001. At that rate of continued growth, there would be about 470,000 people in the capital city in 2022.

