

These graphs, known as population pyramids, illustrate the age and sex of the population in different years and place of residence (rural or urban). The pyramids provide quick and easy perspectives on the structure of Namibia's population and changes over time. For example, a pyramid with a wide bottom indicates a high proportion of young people, while a bulge in the middle as seen in many urban pyramids indicates a high proportion of working-age people.
9.19 Structure of urban and rural populations in 1991, 2001 and 201135
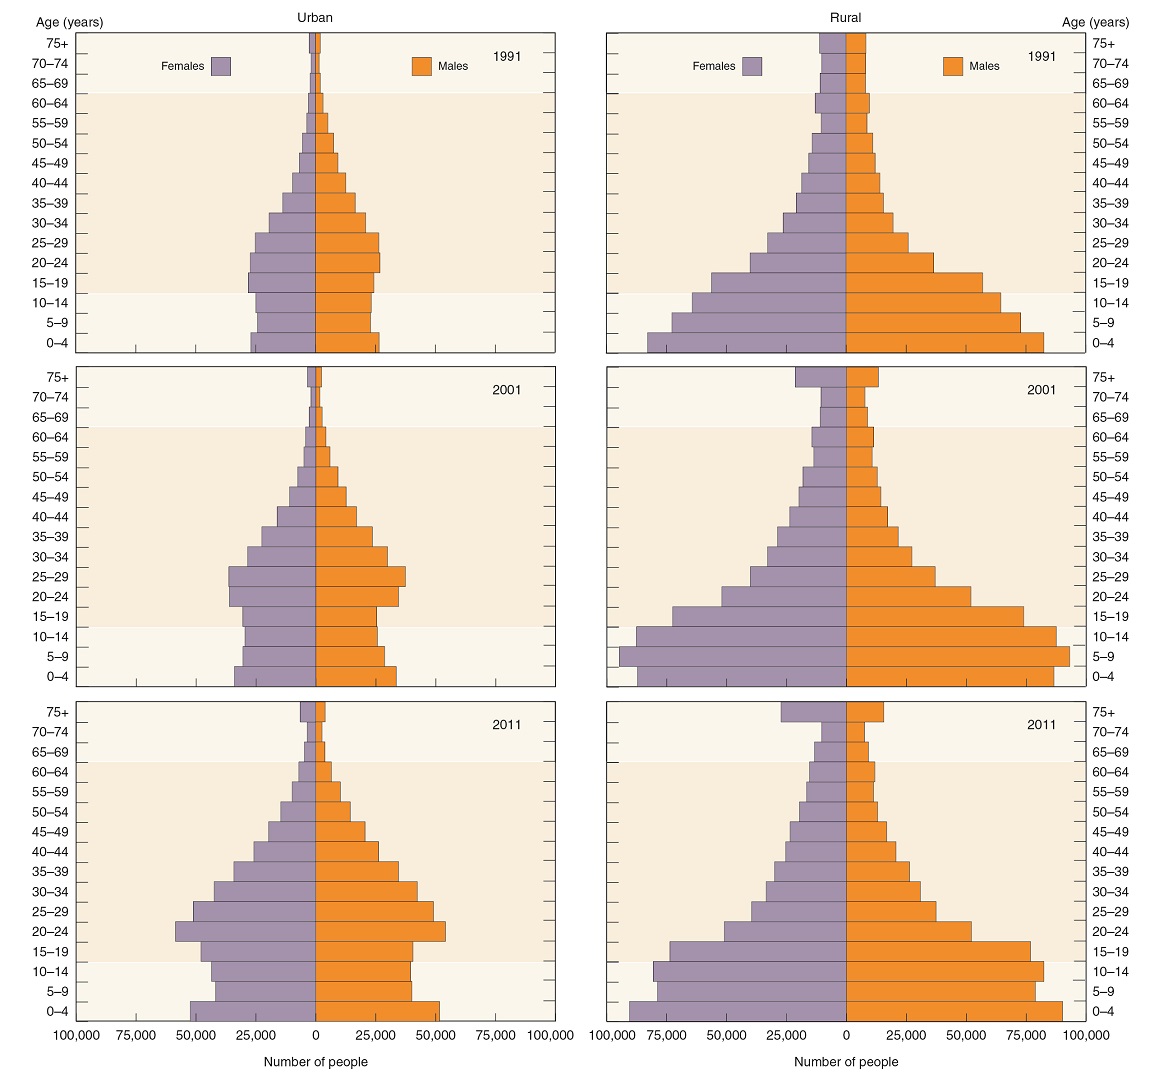
These pyramids show how the structures of urban and rural populations differ, and how they have changed between the censuses conducted in 1991, 2001 and 2011. Urban populations are dominated by people aged 20–40, while children and teenagers dominate rural populations. These patterns were due to the substantial migration of young adults to towns, a movement that was clearest from the age of 20 onwards in 2001 and 2011.
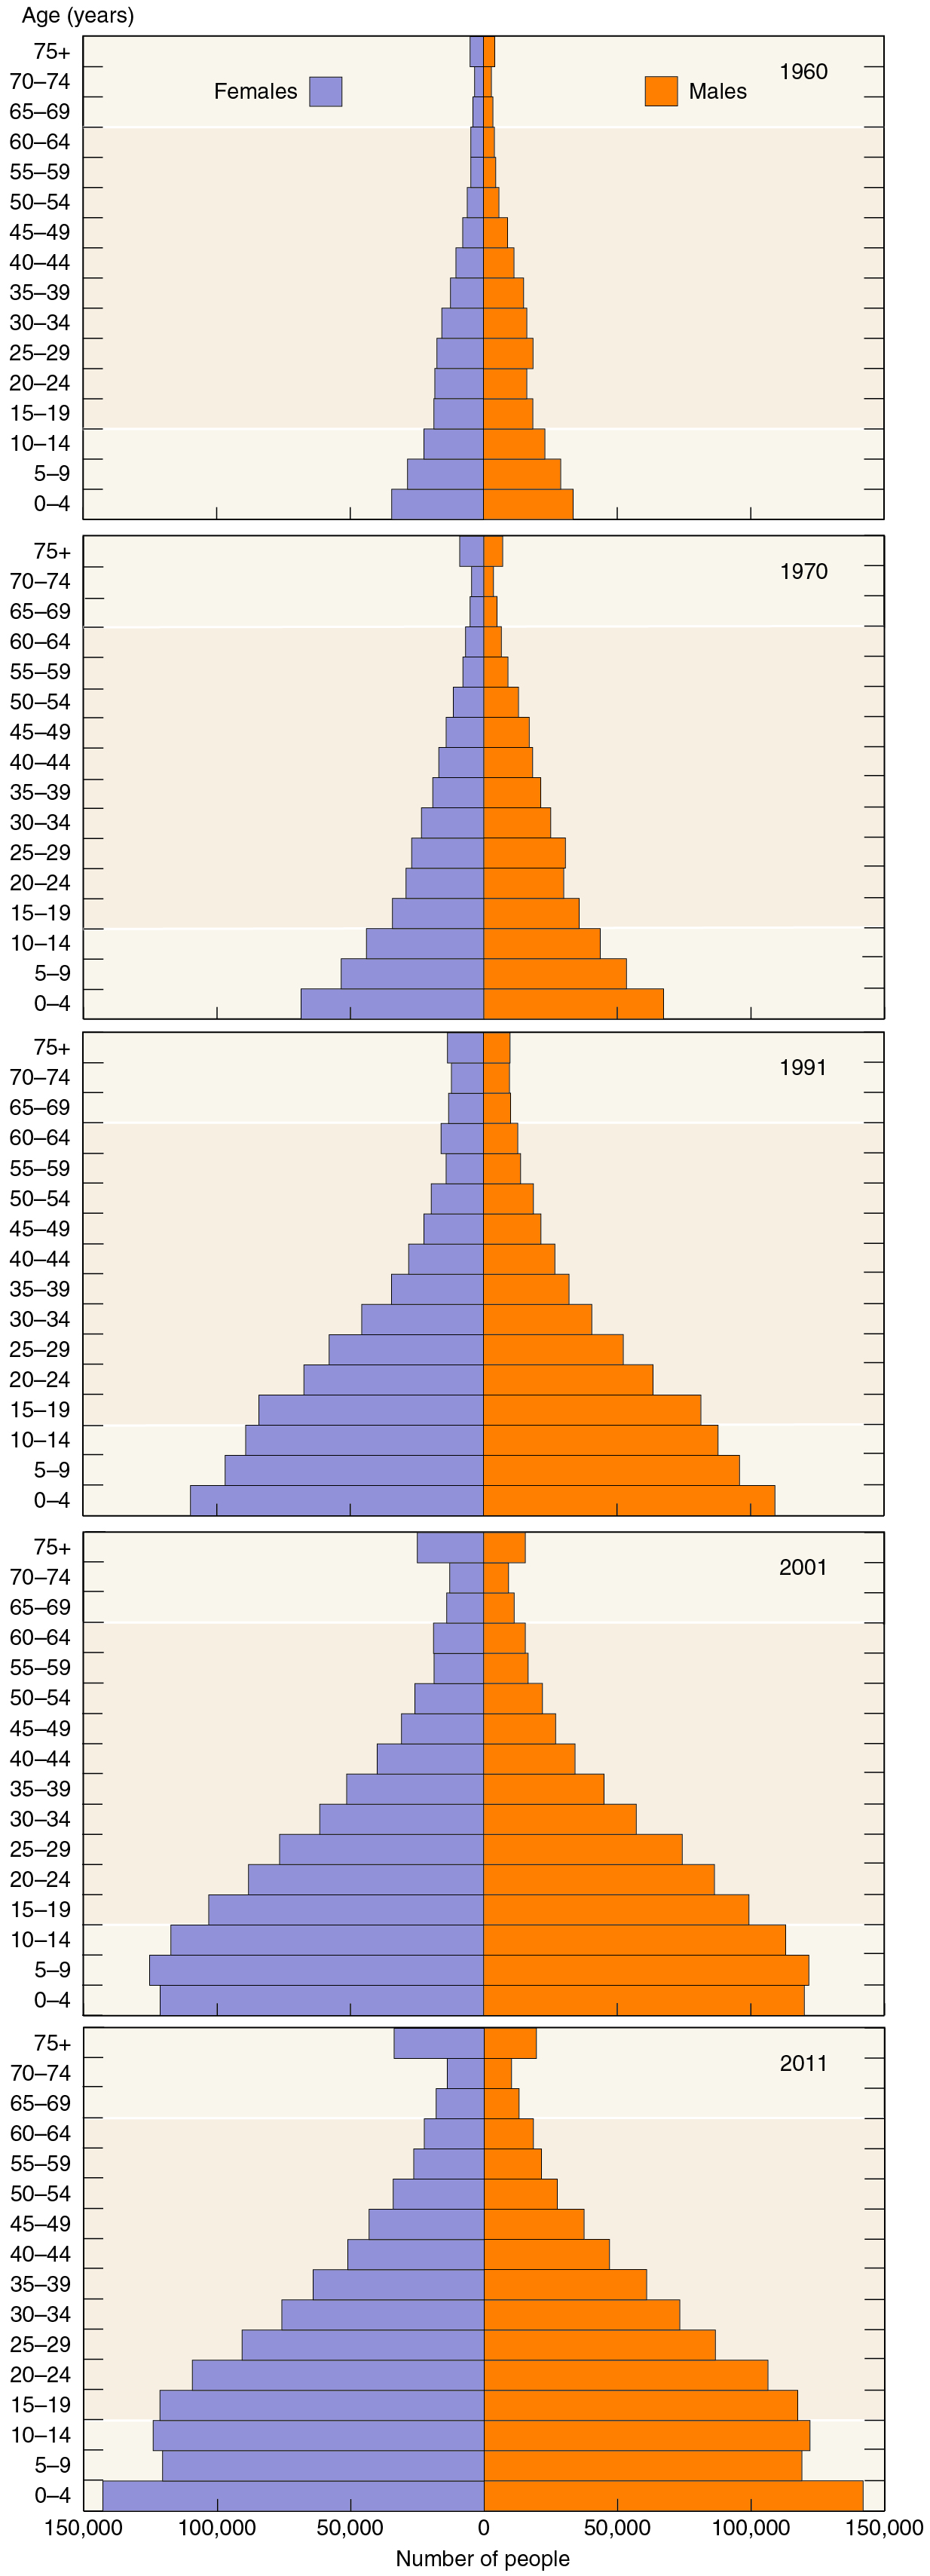
9.20 Structure of Namibia's population in 1960, 1970, 1991, 2001 and 201136

The greatest number of people in the population is usually the youngest – those younger than 5 years. This was the case in all the censuses, but not in 2001. The relative decrease in numbers of children in 2001 was probably due to a decline in birth rate associated with the high HIV infection rates prevalent in the 1990s, before antiretroviral drugs became widely available.
Sex ratios – which compare numbers of males and females – are about 100 among young people, which means that there are 100 females for every 100 males. However, there are more older females than older males because men die earlier than women, on average (figure 9.25). The sex ratio begins to diverge significantly from the age of 40 when the number of women is about 10 per cent higher than the number of men. This percentage difference then grows steadily as the years pass. Interestingly, the ratio of females to males in the entire population has increased over the years, from less than 100 in the 1960s and 1970s to almost 107 in 2011.
9.21 Proportions of dependants in the total population37
| Year | Proportion of 0–14- year-olds (%) | Proportion of people aged 65 and more (%) |
|---|---|---|
| 1960 | 39.8 | 5.4 |
| 1970 | 43.4 | 4.5 |
| 1991 | 41.7 | 4.9 |
| 2001 | 39.3 | 4.8 |
| 2011 | 36.4 | 5.1 |
People under 15 and older than 64 years of age can be regarded as dependants. The total of these two groups as a percentage of the total population provides the statistic known as the dependency ratio. In Namibia, this has ranged between 47.9 in 1970 to 41.5 per cent in 2011, mainly because of the proportion of children decreased. The decrease in the proportion of children is probably a consequence of reduced fertility (figure 9.22) which, in turn, is attributable to the high HIV infection rates in the early 2000s (figure 9.31) and the increasing numbers of educated young women (figure 9.24).
Proportions of elderly people aged 65 and more in the population have been rather stable since the 1960s, ranging between 4.5 and 5.4 per cent.