Household economies
The measures of financial wealth presented in this section were derived from income and expenditure surveys conducted by the Namibia Statistics Agency in 1994, 2004, 2010 and 2016. During these surveys, each surveyed household keeps track of all its expenditures in cash and in kind over a period of four weeks. The values of the expenditure are then extrapolated to estimate total spending per year. Total expenditure is generally equivalent to income because households seldom save significant amounts of income.
Estimates of wealth based on expenditure are also more reliable than those on reported income. Medians are more accurate measures than averages of household wealth because small numbers of very wealthy households skew or distort averages. The median is the number that divides the wealthiest and poorest halves of all the households in an area. In other words, half the households have expenditures higher than a median of say 7,000 Namibian dollars and half have expenditures of less than 7,000 Namibian dollars.
10.02 Median annual expenditure per person, 20201
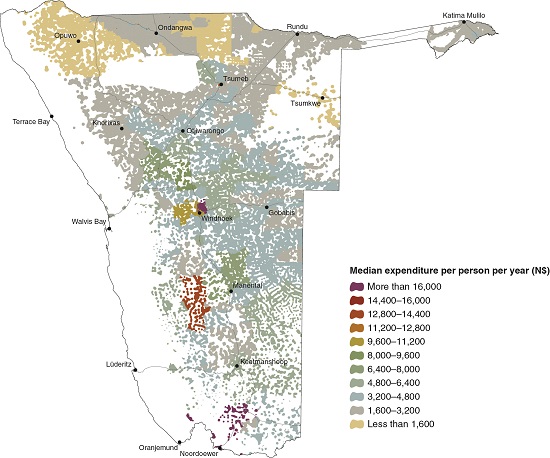
In general, the wealthiest people are in urban areas and the poorest are in rural Namibia. Moreover, the poorest urban residents are generally better off than most rural residents, especially those in remote, sparsely populated communal areas. This comparison takes account of both cash and inkind values. Indeed, it is only in certain communal rural areas where there are substantive income opportunities outside of farming, for example from jobs and businesses, that significant numbers of residents have incomes comparable to those in urban centres.
10.03 Median annual expenditure per person in a selection of urban areas, 20202
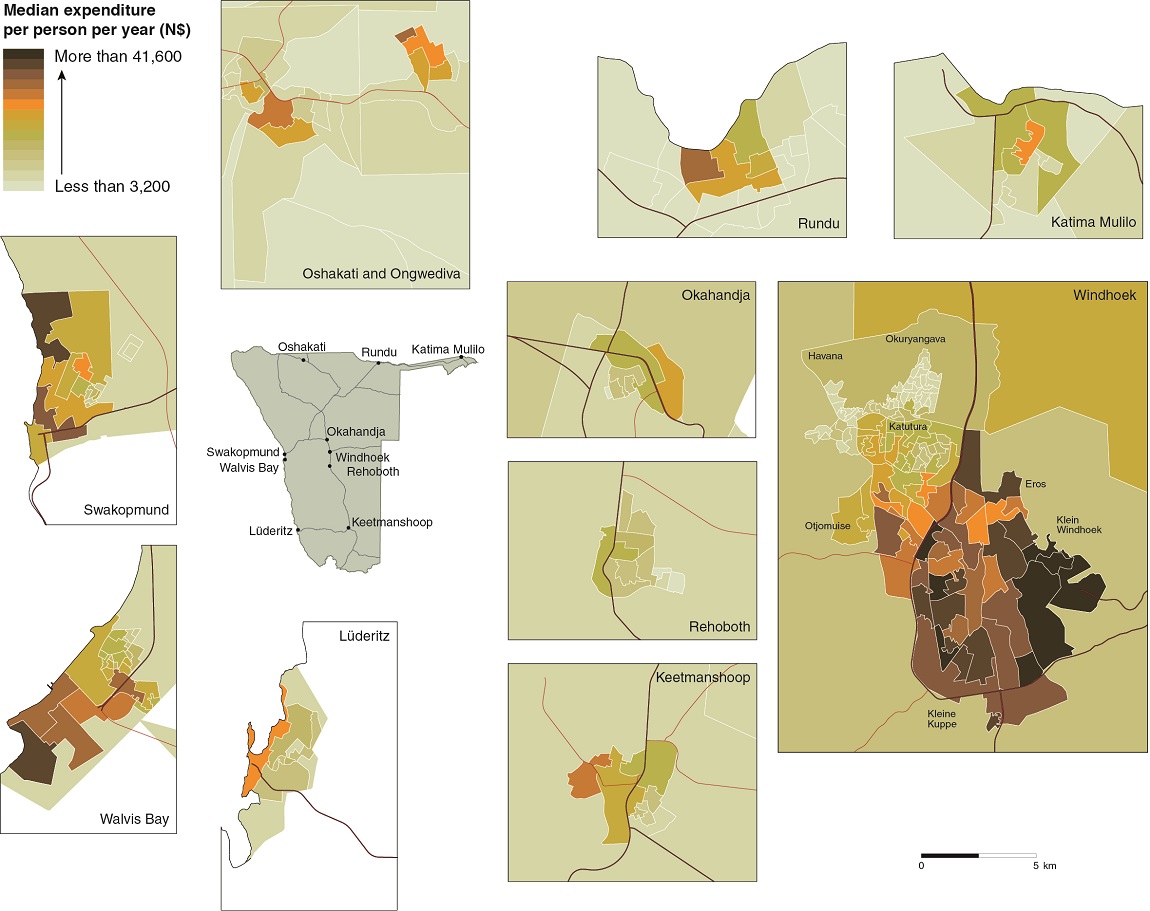
Variation in wealth within these 10 towns, as reflected by median annual expenditure, largely reflects the current socioeconomic divide between formal, wealthier housing and concentrations of poorer people in recently established informal settlements. For example, median expenditure in the wealthiest areas of Windhoek, Walvis Bay and Swakopmund was about 13 times greater than those in the poorest settlements in each of the same towns.
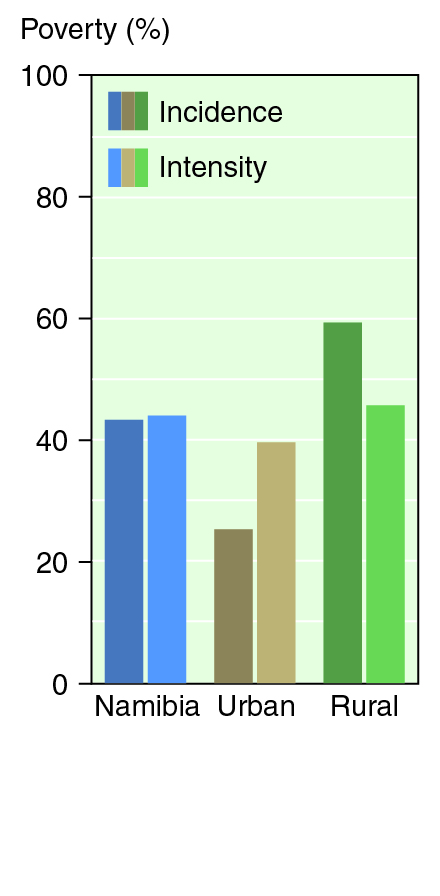
10.04 Incidence and intensity of poverty, 20163

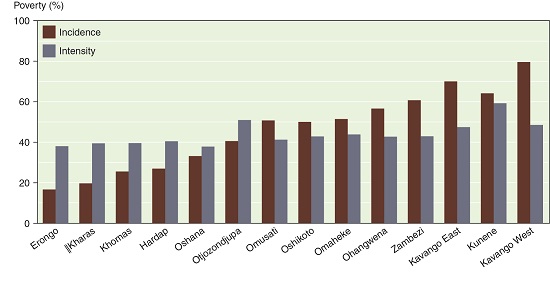
There are many dimensions to poverty which go beyond monetary poverty). One is the incidence of poverty (top) which is the percentage of people not having certain proportions of the following: adequate or reasonable housing, heating and cooking fuels, safe drinking water, communication technology, levels of education, access to health and transportation, and nutrition. Using this measure of incidence, 43.3 per cent of the population in Namibia was classified as poor in 2016. The incidence of poverty in rural areas (59.3 per cent) was more than double that in urban areas (25.3 per cent).
Another measure is the intensity of poverty (also top). In 2016, this was 44.0 per cent, which meant that poor Namibians were deprived on average of 44.0 per cent of services and assets regarded as necessary for wellbeing. The intensity of poverty varied less across the country, suggesting that poor people suffer from similar kinds of deprivation no matter where they live.
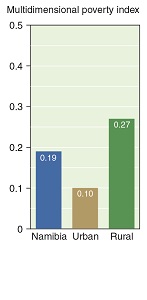
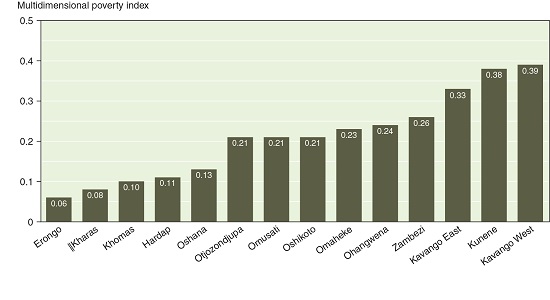
The multidimensional poverty index (bottom) is a composite measure created by multiplying the incidence and intensity of poverty. It provides an index of acute poverty, which, in 2016, was almost three times higher in rural than in urban areas. The index values for Kunene (0.38) and Kavango West (0.39) were six times higher than that for Erongo (0.06).
10.05 Proportions of poor and severely poor households, 2004–20164
Namibia

Urban
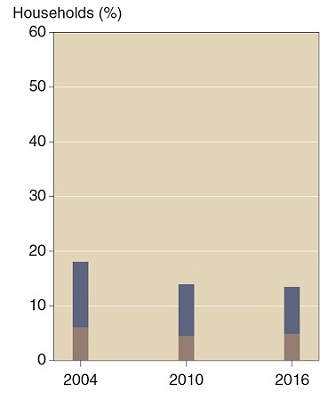
Rural
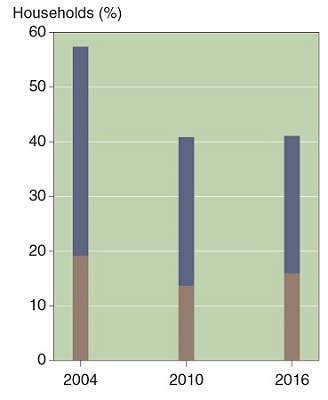
Poverty is measured in Namibia's income and expenditure surveys by calculating the proportion of households able to afford basic needs, such as clothing and health care. Poor households cannot afford these basic needs, while severely poor households are those that are also unable to afford enough food to meet their basic calorific requirements.
Poverty levels declined nationally and in both urban and rural areas between 2004 and 2010, and then marginally between 2010 and 2016. Increased social grants and remittances and increased migration from rural to urban areas were perhaps the major factors that contributed to these improvements. Poor agricultural production and access to markets, and an unwillingness to sell livestock or surplus harvests are significant causes of rural poverty. Many, perhaps most, families in communal areas and on resettlement farms depend on off-farm incomes in the form of remittances, social grants and retail trade in goods and labour.