
Current distribution of people
People are distributed across the Namibian landscape in interesting and surprising ways. More than half live in urban areas; most of these urban areas are too small to be clearly visible on a map of the whole country at a scale that this atlas allows. Most rural residents are in the northeastern and central-northern regions. At the opposite extreme are vast open areas where no-one lives permanently, or where the only souls are nomadic herdsmen or hunter-gathers, or tourists. Limited rain or available water, high temperatures and evaporation, and infertile soils combine to make life tough in these sparsely populated landscapes, many of which are spectacular, despite their remoteness and apparent desolation.
9.13 Population density, 201124
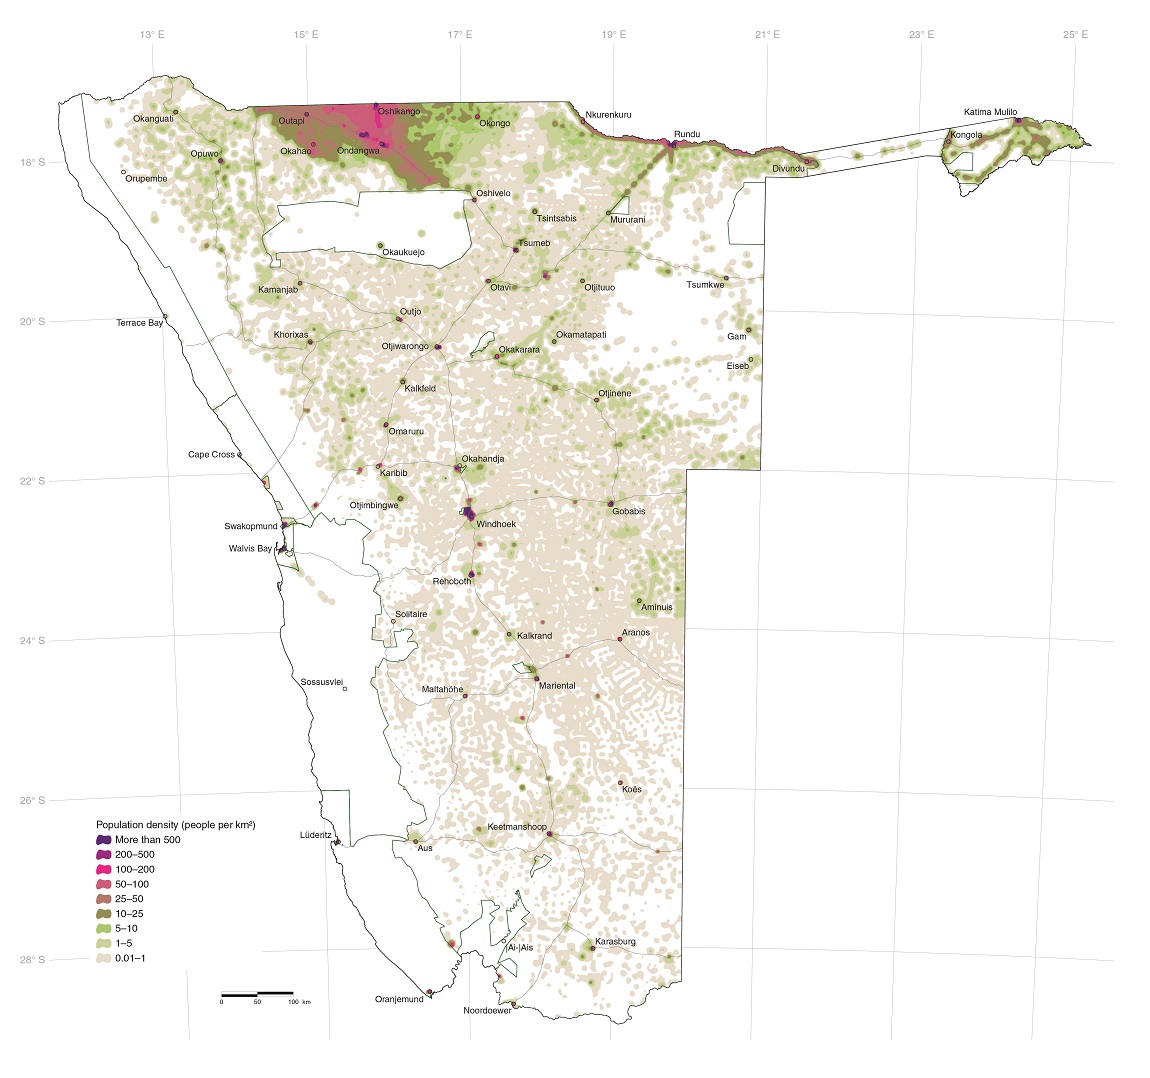
This map reflects the density of people (in numbers of people per square kilometre) in 2011. The highest rural densities are north of 18.5-degree latitude in the eight northern regions of the country, particularly along roads in Zambezi and Kavango East and Kavango West, and along the Okavango River and across the Cuvelai drainage system. Densities gradually decline southwards of this latitude. Exceptions to these broad patterns are the virtual absence of people within 100 kilometres of the coast and the very low densities in northeastern Otjozondjupa and southern Kavango East.
The patterns shown here are comparable to those in a map compiled in 2002 for an earlier atlas of Namibia.25 These patterns should continue over the next decade or two, although population densities in rural areas will decline steadily as more people move to urban areas.
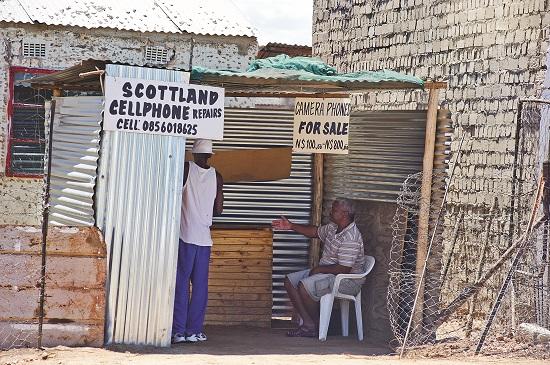
Photo: T Figueira
The greatest population densities are in confined urban areas, and especially in informal housing settlements. These concentrations of people are hard to illustrate in a map of this scale, but this is where about half of the country's population lives.
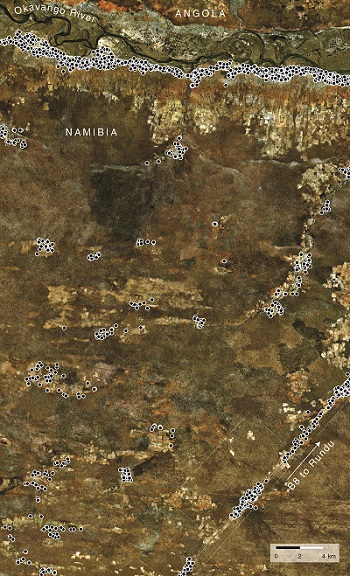
Locations

A - Kavango
B - Former Hereroland

C - Cuvelai

D - Outjo

E - Gobabis

The places people live, and the ways in which their homes are spread across the landscape, are diverse, as these five images show. Much of the diversity in rural areas relates to access to soils suitable for cultivation, water, markets and social services. These patterns are clear in the distribution of homes just west and south of Rundu (image A) where most households are close to more fertile soils along the Okavango River or along old drainage lines away from the river, or along the road south to Mururani and Grootfontein where services (water, schools and clinics) and retail outlets are nearby [18.07° S, 19.41° E]. Likewise, homes in parts of former Hereroland in Otjozondjupa (B) are clustered around old pans where water is more available [21.17° S, 19.20° E]. In the Cuvelai (C), soils suited to cultivation, and water in shallow wells are much more widely available and evenly spread than elsewhere, as reflected in this image just north of Omuthiya in Oshikoto [18.17° S, 16.56° E]. Further north in the Cuvelai, people live on the western margins of dry rivers and old pans where the soils are most fertile. Across much of Namibia, farms are large and homes widely spread because of the arid environment, poor soils and limited water, as illustrated in a freehold farming area north of Outjo (D) [19.65° S, 16.24° E].
These four images (A, B, C and D) each cover 1,500 square kilometres or 150,000 hectares. As might be expected, the number of homes in each area differs greatly: (A) west of Rundu there are 1,958 houses; (B) communal land in Otjozondjupa, 340 houses; (C) Cuvelai in Oshikoto, 5,989 houses; and (D) Outjo freehold farms, 175 houses.
The smallest image (E) covers just 16 square kilometres or 1,600 hectares and shows the town of Gobabis where 7,449 houses were visible when this image was taken [22.44° S, 18.98° E].26 The numbers of houses differ greatly between the formally planned part of the town allocated to commerce and white families prior to independence (566 houses), the low-income housing area (2,119 houses) and the rapidly increasing informal settlements (4,764 houses). These numbers will change, but the patterns and differences in the density and distribution of households are likely to continue.